Qantas 2003 Annual Report Download - page 42
Download and view the complete annual report
Please find page 42 of the 2003 Qantas annual report below. You can navigate through the pages in the report by either clicking on the pages listed below, or by using the keyword search tool below to find specific information within the annual report.-
 1
1 -
2
-
3
-
4
-
5
-
6
-
7
-
8
-
9
-
10
-
11
-
12
-
13
-
14
-
15
-
16
-
17
-
18
-
19
-
20
-
21
-
22
-
23
-
24
-
25
-
26
-
27
-
28
-
29
-
30
-
31
-
 32
32 -
 33
33 -
 34
34 -
 35
35 -
 36
36 -
 37
37 -
 38
38 -
 39
39 -
 40
40 -
 41
41 -
 42
42 -
 43
43 -
 44
44 -
 45
45 -
 46
46 -
 47
47 -
 48
48 -
 49
49 -
 50
50 -
 51
51 -
 52
52 -
53
-
54
-
55
-
56
-
57
-
58
-
59
-
60
 |
 |

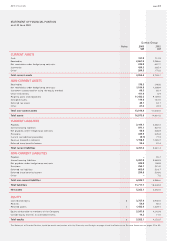
2003 Qantas Annual Report
Qantas Group
Notes 2003 2002
$M $M
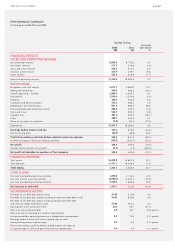
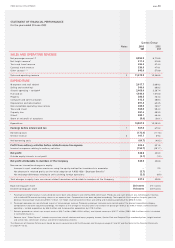
SALES AND OPERATING REVENUE
Net passenger revenue* #8,992.8 8,718.5
Net freight revenue* 511.3 518.8
Tours and travel revenue 696.3 674.4
Contract work revenue 530.9 479.1
Other sources^* * 643.6 578.0
Sales and operating revenue 311,374.9 10,968.8
EXPENDITURE
Manpower and staff related 3,017.7 2,689.2
Selling and marketing* 546.6 608.2
Aircraft operating – variable#2,405.0 2,287.4
Fuel and oil 1,540.4 1,570.0
Property 286.5 264.3
Computer and communication 412.3 408.4
Depreciation and amortisation 891.4 693.5
Non-cancellable operating lease rentals 283.9 255.7
Tours and travel 564.0 584.4
Capacity hire 381.6 499.9
Other#488.1 464.6
Share of net profit of associates (9.6) (36.1)
Expenditure 10,807.9 10,289.5
Earnings before interest and tax 7567.0 679.3
Borrowing costs (172.4) (117.6)
Interest revenue 3107.7 69.3
Net borrowing costs (64.7) (48.3)
Profit from ordinary activities before related income tax expense 502.3 631.0
Income tax expense relating to ordinary activities (155.7) (201.7)
Net profit 346.6 429.3
Outside equity interests in net profit (3.1) (1.3)
Net profit attributable to members of the Company 343.5 428.0
Non-owner transaction changes in equity:
Increase in asset revaluation reserve on using the equity method for investments in associates – 2.9
Net decrease in retained profits on the initial adoption of AASB 1028 “ Employee Benefits” (3.7) –
Net exchange differences relating to self-sustaining foreign operations (2.3) (0.9)
To tal changes in equity from non-owner related transactions attributable to members of the Company 337.5 430.0
Basic earnings per share 20.0 cents 29.1 cents
Diluted earnings per share 19.8 cents 28.9 cents
*Passenger and freight revenue is now disclosed net of both sales discount and interline/IATA commission. Previously, only sales discount was netted against revenue,
with interline/IATA commission being shown as an expense item. Comparatives have been adjusted accordingly. The impact of this change for the prior year is to
decrease net passenger revenue by $505.7 million, net freight revenue by $44.8 million and selling and marketing expenditure by $550.5 million.
#Passenger recoveries are now disclosed as part of net passenger revenue. Previously, passenger recoveries were netted against the relevant expenditure category.
Comparatives have been adjusted accordingly. The impact of this change for the prior year is to increase net passenger revenue by $196.7 million, increase aircraft
operating – variable expenditure by $86.5 million and increase other expenditure by $110.2 million.
* * Excludes proceeds on sale of non-current assets of $36.7 million (2002: $52.0 million), and interest revenue of $107.7 million (2002: $69.3 million) which is included
in net borrowing costs.
^Revenue from “ Other Sources” includes revenue from aircraft charters and leases, property income, Qantas Club and Frequent Flyer membership fees, freight terminal
and service fees, commission revenue, and other miscellaneous income.
The Statement of Financial Performance should be read in conjunction with the Discussion and Analysis on pages 41 and 42 and the Notes to the Financial Statements
on pages 47 to 53.
page 40
STATEMENT OF FINANCIAL PERFORMANCE
for the year ended 30 June 2003