Qantas 2003 Annual Report Download - page 43
Download and view the complete annual report
Please find page 43 of the 2003 Qantas annual report below. You can navigate through the pages in the report by either clicking on the pages listed below, or by using the keyword search tool below to find specific information within the annual report.-
 1
1 -
2
-
3
-
4
-
5
-
6
-
7
-
8
-
9
-
10
-
11
-
12
-
13
-
14
-
15
-
16
-
17
-
18
-
19
-
20
-
21
-
22
-
23
-
24
-
25
-
26
-
27
-
28
-
29
-
30
-
31
-
32
-
 33
33 -
 34
34 -
 35
35 -
 36
36 -
 37
37 -
 38
38 -
 39
39 -
 40
40 -
 41
41 -
 42
42 -
 43
43 -
 44
44 -
 45
45 -
 46
46 -
 47
47 -
 48
48 -
 49
49 -
 50
50 -
 51
51 -
 52
52 -
 53
53 -
54
-
55
-
56
-
57
-
58
-
59
-
60
 |
 |

page 41
Spirit of Australia
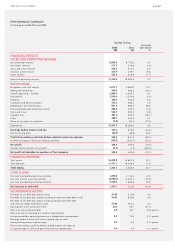
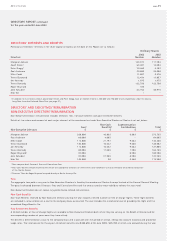
DISCUSSION AND ANALYSIS OF THE STATEMENT OF FINANCIAL PERFORMANCE
for the year ended 30 June 2003
Increase/
(Decrease)
Unit 2003 2002 %
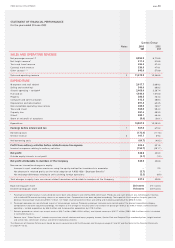
QANTAS GROUP OPERATIONAL STATISTICS
AND PERFORMANCE INDICATORS*
Passengers carried 000 28,884 27,128 6.5
Revenue passenger kilometres (RPKs) M 77,225 75,134 2.8
Available seat kilometres (ASKs) M 99,509 95,944 3.7
Revenue seat factor % 77.6 78.3 (0.7) points
Passenger yield (passenger revenue per RPK) cents 11.15 11.34 (1.7)
Average full-time equivalent employees # 34,872 33,044 5.5
Aircraft in service at balance date # 196 193 3 aircraft
Return on total revenue % 3.0 3.9 (0.9) points
Return on total assets % 2.0 2.9 (0.9) points
Return on equity % 6.5 10.1 (3.6) points
* A glossary of terms appears on page 33.
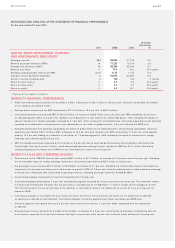
REVIEW OF FINANCIAL PERFORMANCE
Profit from ordinary activities before tax was $502.3 million, a decrease of $128.7 million or 20.4 per cent. Net profit attributable to members
of the company was $343.5 million.
Earnings before interest and tax (EBIT) decreased by $112.3 million or 16.5 per cent to $567.0 million.
International operations contributed EBIT of $221.6 million, an increase of $18.8 million versus the prior year. RPKs reduced by 3.3 per cent
on reduced capacity (ASKs) of 3.4 per cent, leading to an improvement in seat factor of 0.1 percentage points. Yield, excluding the impact of
adverse movements in foreign exchange, increased by 2.1 per cent. After a strong first half performance, international operations were adversely
impacted as the demand for international air travel reduced due to the threat of global terrorism, the war in Iraq and the SARS virus.
Domestic performance was adversely impacted by the effects of global events on the inbound market, and increasing competition. Domestic
operations contributed $165.7 million in EBIT, a decrease of 44.4 per cent over the prior year. RPKs increased by 11.5 per cent while capacity
grew by 13.3 per cent leading to a reduction in seat factor of 1.3 percentage points. Yield, excluding the impact of movements in foreign
exchange rates, deteriorated by 5.8 per cent.
EBIT for subsidiary businesses improved by $1.4 million or 0.8 per cent due to improved performance by Qantas Holidays, QantasLink and
Qantas Flight Catering. Australian Airlines, which commenced operations during the year, recorded an EBIT loss $14.7 million after being
severely impacted by the effects of the SARS virus on international air travel in the final quarter.
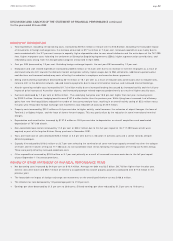
REVIEW OF SALES AND OPERATING REVENUE
To tal revenue for the 2002/03 financial year rose by $406.1 million to $11.4 billion, an increase of 3.7 per cent versus the prior year. Excluding
the unfavourable impact of foreign exchange movements, this increase amounted to $552.5 million or 5.0 per cent.
Net passenger revenue rose by $274.3 million to $9.0 billion, an increase of 3.1 per cent. Excluding the unfavourable impact of exchange rate
movements, this increase was 4.5 per cent and was due to growth in RPKs of 2.8 per cent offset by a deterioration in yield (excluding exchange)
of 0.4 per cent. (Passenger yield is calculated as passenger revenue, excluding passenger recoveries, divided by RPKs.)
Overall Group capacity increased by 3.7 per cent compared with the prior year.
International capacity decreased by 3.4 per cent and domestic capacity increased by 13.3 per cent versus the prior year. This movement reflects
the continued shift between networks that has occurred as a consequence of the September 11 terrorist attacks and the collapse of Ansett.
This shift continued in the current year due to the reduction in international flying in the second half as a result of the war in Iraq and the
impact of SARS.
International capacity in the second half was 7.6 per cent down on the first half and 3.6 per cent down on the second half of 2001/02,
as capacity was reduced to meet demand. International capacity is currently approximately 10 per cent below pre-SARS levels.
Domestic capacity in the second half was 6.5 per cent lower than the first half but 3.1 per cent higher compared with the second half
of 2001/02.
Non-passenger revenue rose by $131.8 million to $2.4 billion, an increase of 5.9 per cent, primarily due to increases in engineering contract
work revenue, improved tours and travel revenue and higher revenue from other sources such as aircraft leases and aircraft financing fees.