Office Depot 2003 Annual Report Download - page 24
Download and view the complete annual report
Please find page 24 of the 2003 Office Depot annual report below. You can navigate through the pages in the report by either clicking on the pages listed below, or by using the keyword search tool below to find specific information within the annual report.-
 1
1 -
2
-
3
-
4
-
5
-
6
-
7
-
8
-
9
-
10
-
11
-
12
-
13
-
 14
14 -
 15
15 -
 16
16 -
 17
17 -
 18
18 -
 19
19 -
 20
20 -
 21
21 -
 22
22 -
 23
23 -
 24
24 -
 25
25 -
 26
26 -
 27
27 -
 28
28 -
 29
29 -
 30
30 -
 31
31 -
 32
32 -
 33
33 -
 34
34 -
35
-
36
-
37
-
38
-
39
-
40
-
41
-
42
-
43
-
44
-
45
-
46
-
47
-
48
-
49
-
50
-
51
-
52
-
53
-
54
-
55
-
56
-
57
-
58
-
59
-
60
-
61
-
62
-
63
-
64
-
65
-
66
-
67
-
68
-
69
-
70
-
71
-
72
-
73
-
74
-
75
-
76
-
77
-
78
-
79
-
80
-
81
-
82
-
83
-
84
-
85
-
86
-
87
-
88
-
89
-
90
-
91
-
92
-
93
-
94
-
95
-
96
-
97
-
98
-
99
-
100
-
101
-
102
-
103
-
104
-
105
-
106
-
107
-
108
 |
 |

additional borrowing. Similarly, 2002 reflects the impact of a
full year of interest on the $250 million of senior subordinated
notes issued in July 2001 and which mature in 2008. The
effective interest rate on the $400 million notes has been
reduced by the amortization of proceeds from an interest rate
lock of $16.6 million. Additionally, the effective interest rate
on the $250 million notes has been reduced by the amortiza-
tion of $18.8 million from the September 2002 termination of
an interest rate swap agreement. The proceeds received from
both the interest rate lock and the interest rate swaps are being
amortized to interest expense over the remaining term of the
respective notes.
When a facility is closed before the end of an operating
lease commitment, we record a liability at the present value of
the lease obligation, offset by anticipated sublease income.
For facilities closed prior to 2003, the imputed interest cost on
the discounted obligations is recognized as interest expense
each period. The recorded obligations primarily relate to the
store closures following the 2000 business review and total
$57.6 million at December 27, 2003 and $60.4 million at
December 28, 2002.
Our net miscellaneous income (expense) consists of equity
in the earnings of our joint venture investments, royalty and
franchise income that we generate from licensing and fran-
chise agreements, and realized gains and impairments of other
investments. All of our equity investments involve operations
outside of the United States and Canada. In 2003, we sold or
abandoned a majority of our interest in certain Internet com-
panies, resulting in a fourth quarter charge of $8.4 million. In
2002 and 2001, we recorded charges of $3.0 million and
$14.7 million, respectively, related to the impairment of these
investments. In 2003, this category also includes recognition
of approximately $11.8 million of net foreign currency gains,
primarily resulting from holding euro investments in anticipa-
tion of purchasing Guilbert in June 2003.
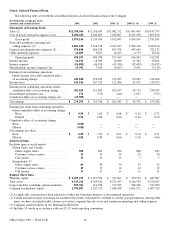
Income Taxes
(Dollars in thousands) 2003 2002 2001
Income Taxes . . . . . . . . $143,016 $167,722 $112,296
Effective income
tax rate* . . . . . . . . . . 32% 35% 36%
*Income Taxes as a percentage of earnings from continuing
operations before income taxes.
The effective income tax rate has decreased over the three
years presented, reflecting an increased proportion of interna-
tional activity, which may be taxed at lower rates and, in 2003,
realization of certain state tax credits. The effective tax rate in
future periods can be affected by variability in our mix of
income and tax rates in the various jurisdictions and therefore
may be higher or lower than it has been over the past three
years. The effective tax rate is expected to be somewhat lower
at the beginning of 2004 and will be monitored and adjusted
throughout the year for the actual mix of income.
Liquidity and Capital Resources
Cash provided by (used in) our operating, investing and
financing activities is summarized as follows:
(Dollars in thousands) 2003 2002 2001
Operating activities. . . $651,740 $ 701,897 $ 745,941
Investing activities . . . (1,179,837) (199,466) (233,071)
Financing activities. . . 388,851 (212,625) (85,403)
Operating and Investing Activities
We have consistently satisfied operating liquidity needs
and planned capital expenditure programs through our normal
conversion of sales to cash. Over the three years ended in
2003, we generated over $2 billion of cash flows from operat-
ing activities. From time to time, we use our revolving credit
facility for normal operating needs, primarily near the time of a
significant non-operating cash outlay. We have also accessed
the capital markets to supplement our cash position following
acquisitions and for refinancings.
Our major sources of cash from operations include: store
sales, a majority of which are generated on a cash and carry
basis, our private label credit card program, which is adminis-
tered by a third party financial services company and converted
to cash daily, and collection of our receivables. We generate
receivables from our contract and certain direct mail customers,
and as we expand this business here and abroad, we anticipate
our accounts receivable portfolio will grow. Additionally,
amounts due us under rebate and cooperative advertising
programs with our vendors comprised over 25% of total
receivables at the end of 2003 and 35% at the end of 2002.
These receivables tend to fluctuate seasonally (growing during
the second half of the year and declining during the first half),
because certain collections do not occur until specified mile-
stones are reached or the program year is complete. These
receivables, however, are typically high quality and are col-
lected quickly after reaching specified milestones. Our primary
outflow of cash from operations is the purchase of inventory,
net of customary credit arrangements with vendors, operational
costs, and the payment of current taxes.
Cash flows provided by operating activities in 2003 reflect
lower net income as compared to 2002 and changes in working
capital, more than offset by increases in non-cash charges and
depreciation. Changes in working capital reflect an increase in
inventories coupled with a decrease in accrued liabilities. The
decrease in current liabilities reflects payments on closed store
liabilities, accrued employee compensation, and settlement of
accrued expenses, as well as the timing of year-end purchases
and vendor payments. The increase in inventories reflects
lower than expected sales in our North American Retail
Division during the fourth quarter, and an intentional build up
of certain products to support the holiday season and, our new
retail merchandising initiatives. We do not believe that the
additional inventories add to our product life cycle or obsoles-
cence risk. The non-cash operating items primarily include an
Office Depot 2003 / Form 10-K 22