Office Depot 2003 Annual Report Download - page 21
Download and view the complete annual report
Please find page 21 of the 2003 Office Depot annual report below. You can navigate through the pages in the report by either clicking on the pages listed below, or by using the keyword search tool below to find specific information within the annual report.-
 1
1 -
2
-
3
-
4
-
5
-
6
-
7
-
8
-
9
-
10
-
 11
11 -
 12
12 -
 13
13 -
 14
14 -
 15
15 -
 16
16 -
 17
17 -
 18
18 -
 19
19 -
 20
20 -
 21
21 -
 22
22 -
 23
23 -
 24
24 -
 25
25 -
 26
26 -
 27
27 -
 28
28 -
 29
29 -
 30
30 -
 31
31 -
32
-
33
-
34
-
35
-
36
-
37
-
38
-
39
-
40
-
41
-
42
-
43
-
44
-
45
-
46
-
47
-
48
-
49
-
50
-
51
-
52
-
53
-
54
-
55
-
56
-
57
-
58
-
59
-
60
-
61
-
62
-
63
-
64
-
65
-
66
-
67
-
68
-
69
-
70
-
71
-
72
-
73
-
74
-
75
-
76
-
77
-
78
-
79
-
80
-
81
-
82
-
83
-
84
-
85
-
86
-
87
-
88
-
89
-
90
-
91
-
92
-
93
-
94
-
95
-
96
-
97
-
98
-
99
-
100
-
101
-
102
-
103
-
104
-
105
-
106
-
107
-
108
 |
 |

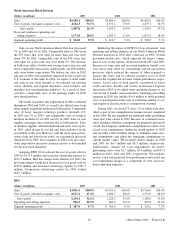
Sales in our North American Retail Division decreased
3% in 2003 and 1% in 2002. Comparable sales in 2003 from
the 870 stores that were open for more than one year were
down 4%. In 2002, comparable sales in the 848 stores that
were open for at least one year were down 2%. The decrease
in both years reflects both lower average transaction size and
fewer comparable transactions. Additionally, our 2003 holiday
sales were below expectations. We believe our sales in 2002
and part of 2003 were negatively impacted by the overall soft
U.S. economy at that time. In 2004, we expect to drive traffic
and sales in our retail channel as we remodel our existing
stores, identify and expand alternative store formats, and
introduce new merchandising initiatives. As a result of these
activities, comparable sales in the opening weeks of 2004
have turned positive.
The trends in product mix experienced in 2001 continued
throughout 2002 and 2003, as overall sales shifted away from
lower margin technology products in both periods. Comparable
sales of lower margin technology products declined 11%
in 2003 and 7% in 2002; and comparable sales of business
furniture declined 4% in 2003 and 6% in 2002. Sales of core
supplies and paper were relatively flat in both periods. Sales
of machine supplies, which include ink and toner, were up 4%
in 2003, aided in part by our ink and toner initiatives in the
second half of the year. However, with the more open presen-
tation of ink and toner in our stores, we experienced increased
shrink levels in 2003. Gross margins in 2003 were also nega-
tively impacted by increased clearance activity as we launched
several new retail initiatives.
Adopting EITF 02-16 reduced the cost of goods sold for
2003 by $135.3 million and increased advertising expense by
$132.5 million. Had this change been effective for 2002, the
pro forma impact would have decreased cost of goods sold by
$150.9 million and increased advertising expense by $151.5
million. Cooperative advertising credits for 2001 totaled
$167.1 million.
Reflecting the impact of EITF 02-16 on all periods, total
operating and selling expenses in our North American Retail
Division increased in 2003 after a decrease in 2002. Overall
personnel-related costs, which represent the largest compo-
nent of costs in this caption, decreased in both 2003 and 2002.
Increases in wage rates and in certain employee benefit costs
were more than offset by streamlining certain operational
processes which reduced the amount of labor required to
operate the stores and by reduced incentive costs in 2003
because the segment did not meet overall performance expec-
tations. Lower sales in both periods contributed to lower
credit card fees. Facility and facility maintenance expense
increased in 2003 as we added stores and made changes to our
store layout to handle various initiatives. Operating and selling
expenses in 2002 also include $14.4 million to settle potential
class action litigation in the state of California relating to cer-
tain employee classifications as exempt from overtime.
During 2001, we closed 73 stores, 70 of which were iden-
tified as part of our comprehensive business review completed
in late 2000. We also identified ten additional under-performing
stores that were closed in 2002. Because of continued uncer-
tainty relating to sublease assumptions for properties previously
closed, the Company conducted a comprehensive review of its
closed store commitments during the fourth quarter of 2003
and recorded a $23.9 million charge to terminate some exist-
ing commitments and adjust the remaining commitments to
current market values. We recorded similar charges in 2002
and 2001 for $6.7 million and $8.5 million, respectively.
Additionally, charges for asset impairments for under-
performing stores were $2.7 million, $5.4 million, and $35.2
million in 2003, 2002 and 2001, respectively. We regularly
review actual and projected store performance and record any
asset impairment charges as a component of store and ware-
house operating expenses.
19 Office Depot 2003 / Form 10-K
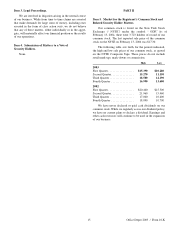
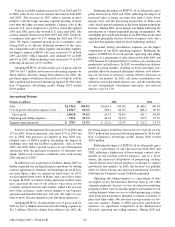
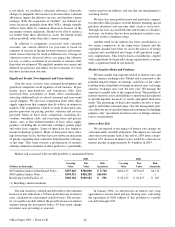
BSG
(Dollars in millions) 2003 2002 2001
Sales . . . . . . . . . . . . . . . . . . . . . . . . . . . . . . . . $3,965.3 100.0% $3,913.9 100.0% $3,763.0 100.0%
Cost of goods sold and occupancy costs . . . 2,671.2 67.4% 2,684.7 68.6% 2,574.0 68.4%
Gross profit . . . . . . . . . . . . . . . . . . . . . . . . 1,294.1 32.6% 1,229.2 31.4% 1,189.0 31.6%
Operating and selling expenses . . . . . . . . . . . 906.2 22.9% 864.6 22.1% 897.8 23.9%
Segment operating profit . . . . . . . . . . . . . . . . $387.9 9.7% $ 364.6 9.3% $ 291.2 7.7%
North American Retail Division
(Dollars in millions) 2003 2002 2001
Sales . . . . . . . . . . . . . . . . . . . . . . . . . . . . . . . . $5,650.1 100.0% $5,804.4 100.0% $5,842.6 100.0%
Cost of goods sold and occupancy costs . . . 4,162.3 73.7% 4,351.2 75.0% 4,479.1 76.7%
Gross profit . . . . . . . . . . . . . . . . . . . . . . 1,487.8 26.3% 1,453.2 25.0% 1,363.5 23.3%
Store and warehouse operating and
selling expenses . . . . . . . . . . . . . . . . . . . . . 1,173.8 20.8% 1,033.5 17.8% 1,055.2 18.0%
Segment operating profit . . . . . . . . . . . . . . . . $314.0 5.5% $ 419.7 7.2% $ 308.3 5.3%