Office Depot 2003 Annual Report Download - page 22
Download and view the complete annual report
Please find page 22 of the 2003 Office Depot annual report below. You can navigate through the pages in the report by either clicking on the pages listed below, or by using the keyword search tool below to find specific information within the annual report.-
 1
1 -
2
-
3
-
4
-
5
-
6
-
7
-
8
-
9
-
10
-
11
-
 12
12 -
 13
13 -
 14
14 -
 15
15 -
 16
16 -
 17
17 -
 18
18 -
 19
19 -
 20
20 -
 21
21 -
 22
22 -
 23
23 -
 24
24 -
 25
25 -
 26
26 -
 27
27 -
 28
28 -
 29
29 -
 30
30 -
 31
31 -
 32
32 -
33
-
34
-
35
-
36
-
37
-
38
-
39
-
40
-
41
-
42
-
43
-
44
-
45
-
46
-
47
-
48
-
49
-
50
-
51
-
52
-
53
-
54
-
55
-
56
-
57
-
58
-
59
-
60
-
61
-
62
-
63
-
64
-
65
-
66
-
67
-
68
-
69
-
70
-
71
-
72
-
73
-
74
-
75
-
76
-
77
-
78
-
79
-
80
-
81
-
82
-
83
-
84
-
85
-
86
-
87
-
88
-
89
-
90
-
91
-
92
-
93
-
94
-
95
-
96
-
97
-
98
-
99
-
100
-
101
-
102
-
103
-
104
-
105
-
106
-
107
-
108
 |
 |

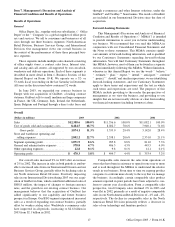
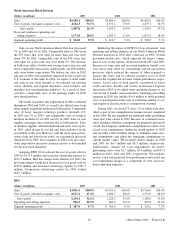
Sales in our BSG segment increased 1% in 2003 and 4%
in 2002. Sales in our contract channel increased in both 2003
and 2002. The increase in 2003 reflects growth in most
markets, with the large customer segment growing at faster
rates than the other customer segments. Contract sales in the
eastern U.S. have displayed a positive trend throughout
2003 and 2002 and in the western U.S. since mid-2002. The
catalog channel decreased in both 2003 and 2002. Domestic
e-commerce sales grew by 15% during the 2003 and 33% in
2002. We expect continued growth in our e-commerce sales
during 2004 as we allocate additional resources to that chan-
nel. Comparable sales of office supplies and machine supplies,
the largest category in BSG’s sales mix, increased 3% in both
2003 and 2002. Office furniture sales declined 3% in 2003
and 8% in 2002, while technology sales decreased 1% in 2003
following an increase of 5% in 2002.
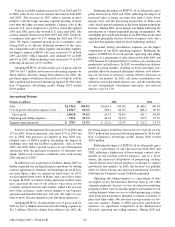
Adopting EITF 02-16 reduced the cost of goods sold for
2003 by $63.7 million and increased advertising expense by
$60.0 million. Had this change been effective for 2002, the
pro forma impact would have decreased cost of goods sold by
$66.1 million and increased advertising expense by $66.6 mil-
lion. Cooperative advertising credits during 2001 totaled
$83.9 million.
Reflecting the impact of EITF 02-16 on all periods, gross
profit decreased in 2003 and 2002, reflecting the impact of
increased sales to larger accounts that tend to have lower
margin rates and the increasing proportion of 4Sure.com
sales, which operates primarily in the lower margin technology
business. During 2001, gross margin was higher following the
introduction of volume-dependent pricing arrangements. We
earn higher gross profit percentages in our BSG than in our retail
operations principally because of lower occupancy costs and a
sales mix that includes relatively fewer technology products.
Personnel, facility and delivery expenses are the largest
components of our BSG operating expenses. Reflecting the
impact of EITF 02-16 on all periods, operating and selling
expenses as a percentage of sales decreased in both 2003 and
2002 because of continued efforts to reduce costs and increase
productivity and efficiency. In 2003, we modified our delivery
model in certain markets, resulting in lower personnel costs
partially offset by increased third-party delivery costs follow-
ing our decision to outsource certain delivery functions in
some of our markets. In 2002, call center consolidation con-
tributed to lower personnel-related costs, and the introduction
of new technologies streamlined operations and reduced
delivery costs by 13%.
Office Depot 2003 / Form 10-K 20
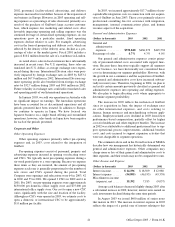
International Division
(Dollars in millions) 2003 2002 2001
Sales . . . . . . . . . . . . . . . . . . . . . . . . . . . . . . . . $2,746.5 100.0% $1,641.4 100.0% $1,480.1 100.0%
Cost of goods sold and occupancy costs . . . 1,652.7 60.2% 988.1 60.2% 888.4 60.0%
Gross profit . . . . . . . . . . . . . . . . . . . . . . . . 1,093.8 39.8% 653.3 39.8% 591.7 40.0%
Operating and selling expenses . . . . . . . . . . . 723.1 26.3% 441.2 26.9% 379.5 25.7%
Segment operating profit . . . . . . . . . . . . . . . . $370.7 13.5% $ 212.1 12.9% $ 212.2 14.3%
Sales in our International Division grew 67% in 2003 and
11% in 2002. In local currencies, sales grew 52% in 2003 and
6% in 2002. Our purchase of Guilbert in June 2003 con-
tributed sales of $808.8 million. Excluding the impact of
exchange rates and the Guilbert acquisition, sales in both
2003 and 2002 reflect growth in most of our international
operations with the principal exceptions of Germany and
Japan, where local economic conditions were weak during
2002 and most of 2003.
In addition to our acquisition of Guilbert, during 2003 we
further expanded our existing European operations by starting
contract operations in Germany and launching our retail busi-
ness into Spain, where we opened six retail stores. In 2003,
we also opened three stores in France and a net of five stores
in Japan. In 2002, we added catalog operations in three coun-
tries; increased the size of our contract sales force in four
countries; initiated contract sales in Italy; added a net of seven
new stores in France; made several changes to our Japanese
operation and launched nine new web sites. We expect to con-
tinue to grow all sales channels in our European operations.
Adopting EITF 02-16 reduced the cost of goods sold for
2003 by $41.4 million and increased advertising expense by
$41.7 million. Had this change been effective for 2002, the
pro forma impact would have decreased cost of goods sold by
$24.3 million and increased advertising expense by $24.6 mil-
lion. Cooperative advertising credits during 2001 totaled
$20.9 million.
Reflecting the impact of EITF 02-16 on all periods, gross
profit as a percentage of sales decreased in both 2003 and
2002, reflecting a higher mix of lower margin contract sales,
growth in our existing contract business, and to a lesser
extent, the increased distribution of prospecting catalogs
(which feature lower priced products) in Europe to support
growth into new markets. In 2003, the decrease was partially
offset by better buying and increased purchasing discounts
following the Company’s recent Guilbert acquisition.
Operating and selling expenses as a percentage of sales
are higher in our International Division than in our other
segments primarily because we use an extensive marketing
program to drive sales in existing markets, particularly in our
catalog business where we use so-called prospecting catalogs
with lower-priced products intended to induce customers to
place first-time orders. We also had start-up activities in sev-
eral new markets. Similar to BSG, personnel and delivery
expenses are significant components of the International
Division’s operating and selling expenses. During 2003 and