Nokia 2007 Annual Report Download - page 83
Download and view the complete annual report
Please find page 83 of the 2007 Nokia annual report below. You can navigate through the pages in the report by either clicking on the pages listed below, or by using the keyword search tool below to find specific information within the annual report.-
 1
1 -
2
-
3
-
4
-
5
-
6
-
7
-
8
-
9
-
10
-
11
-
12
-
13
-
14
-
15
-
16
-
17
-
18
-
19
-
20
-
21
-
22
-
23
-
24
-
25
-
26
-
27
-
28
-
29
-
30
-
31
-
32
-
33
-
34
-
35
-
36
-
37
-
38
-
39
-
40
-
41
-
42
-
43
-
44
-
45
-
46
-
47
-
48
-
49
-
50
-
51
-
52
-
53
-
54
-
55
-
56
-
57
-
58
-
59
-
60
-
61
-
62
-
63
-
64
-
65
-
66
-
67
-
68
-
69
-
70
-
71
-
72
-
 73
73 -
 74
74 -
 75
75 -
 76
76 -
 77
77 -
 78
78 -
 79
79 -
 80
80 -
 81
81 -
 82
82 -
 83
83 -
 84
84 -
 85
85 -
 86
86 -
 87
87 -
 88
88 -
 89
89 -
 90
90 -
 91
91 -
 92
92 -
 93
93 -
94
-
95
-
96
-
97
-
98
-
99
-
100
-
101
-
102
-
103
-
104
-
105
-
106
-
107
-
108
-
109
-
110
-
111
-
112
-
113
-
114
-
115
-
116
-
117
-
118
-
119
-
120
-
121
-
122
-
123
-
124
-
125
-
126
-
127
-
128
-
129
-
130
-
131
-
132
-
133
-
134
-
135
-
136
-
137
-
138
-
139
-
140
-
141
-
142
-
143
-
144
-
145
-
146
-
147
-
148
-
149
-
150
-
151
-
152
-
153
-
154
-
155
-
156
-
157
-
158
-
159
-
160
-
161
-
162
-
163
-
164
-
165
-
166
-
167
-
168
-
169
-
170
-
171
-
172
-
173
-
174
-
175
-
176
-
177
-
178
-
179
-
180
-
181
-
182
-
183
-
184
-
185
-
186
-
187
-
188
-
189
-
190
-
191
-
192
-
193
-
194
-
195
-
196
-
197
-
198
-
199
-
200
-
201
-
202
-
203
-
204
-
205
-
206
-
207
-
208
-
209
-
210
-
211
-
212
-
213
-
214
-
215
-
216
-
217
-
218
-
219
-
220
 |
 |
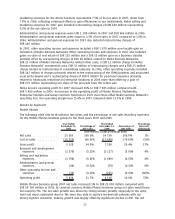
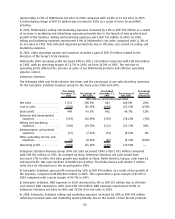
operating profit included the negative impact of EUR 39 million incremental costs related to Nokia
Siemens Networks. The business group’s operating margin for 2006 was 10.8% compared with 13.0%
in 2005. The lower operating profit primarily reflected pricing pressure and our efforts to gain market
share, a greater proportion of sales from the emerging markets and a higher share of service sales.
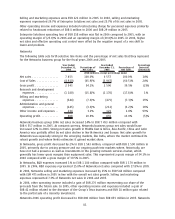
Common Group Expenses
Common Group expenses totaled EUR 481 million in 2006 compared with EUR 392 million in 2005. In
2005, this included a EUR 45 million gain for real estate sales.
Net Financial Income
Net financial income totaled EUR 207 million in 2006 compared with EUR 322 million in 2005. Net
financial income included a EUR 57 million gain from the sale of the remaining France Telecom bond
in 2005. Interest income decreased as a result of a lower level of cash and other liquid assets due to
higher share buybacks. Above mentioned lower gains and lower interest income were the main
reasons for lower net financial income in 2006 than in 2005.
The net debt to equity ratio was negative (68%) at December 31, 2006 compared with a net debt to
equity ratio of (77%) at December 31, 2005. See “Item 5.B Liquidity and Capital Resources” below.
Profit Before Taxes
Profit before tax and minority interests increased 15% to EUR 5 723 million in 2006 compared with
EUR 4 971 million in 2005. Taxes amounted to EUR 1 357 million and EUR 1 281 million in 2006 and
2005, respectively. In 2006, taxes include received and accrued tax refunds from previous years of
EUR 84 million compared with EUR 48 million in 2005. The effective tax rate decreased to 23.7% in
2006 compared with 25.8% in 2005, due to mix of foreign earnings.
Minority Interests
Minority shareholders’ interest in our subsidiaries’ profits totaled EUR 60 million in 2006 compared
with EUR 74 million in 2005.
Net Profit and Earnings per Share
Net profit in 2006 totaled EUR 4 306 million compared with EUR 3 616 million in 2005, representing a
yearonyear increase in net profit of 19% in 2006. Earnings per share in 2006 increased to EUR 1.06
(basic) and 1.05 (diluted) compared with EUR 0.83 (basic and diluted) in 2005.
Related Party Transactions
There have been no material transactions during the last three fiscal years to which any director,
executive officer or at least 5% shareholder, or any relative or spouse of any of them, was party.
There is no significant outstanding indebtedness owed to Nokia by any director, executive officer or
at least 5% shareholder.
There are no material transactions with enterprises controlling, controlled by or under common
control with Nokia or associates of Nokia.
See Note 31 to our consolidated financial statements included in Item 18 of this annual report.
Exchange Rates
Our business and results of operations are from time to time affected by changes in exchange rates,
particularly between the euro and other currencies such as the US dollar, the Chinese yuan, the UK
pound sterling and the Japanese yen. See “Item 3.A Selected Financial Data—Exchange Rate Data.”
Foreign currency denominated assets and liabilities, together with highly probable purchase and sale
commitments, give rise to foreign exchange exposure. In general, depreciation of another currency
82