Nokia 2007 Annual Report Download - page 63
Download and view the complete annual report
Please find page 63 of the 2007 Nokia annual report below. You can navigate through the pages in the report by either clicking on the pages listed below, or by using the keyword search tool below to find specific information within the annual report.-
 1
1 -
2
-
3
-
4
-
5
-
6
-
7
-
8
-
9
-
10
-
11
-
12
-
13
-
14
-
15
-
16
-
17
-
18
-
19
-
20
-
21
-
22
-
23
-
24
-
25
-
26
-
27
-
28
-
29
-
30
-
31
-
32
-
33
-
34
-
35
-
36
-
37
-
38
-
39
-
40
-
41
-
42
-
43
-
44
-
45
-
46
-
47
-
48
-
49
-
50
-
51
-
52
-
 53
53 -
 54
54 -
 55
55 -
 56
56 -
 57
57 -
 58
58 -
 59
59 -
 60
60 -
 61
61 -
 62
62 -
 63
63 -
 64
64 -
 65
65 -
 66
66 -
 67
67 -
 68
68 -
 69
69 -
 70
70 -
 71
71 -
 72
72 -
 73
73 -
74
-
75
-
76
-
77
-
78
-
79
-
80
-
81
-
82
-
83
-
84
-
85
-
86
-
87
-
88
-
89
-
90
-
91
-
92
-
93
-
94
-
95
-
96
-
97
-
98
-
99
-
100
-
101
-
102
-
103
-
104
-
105
-
106
-
107
-
108
-
109
-
110
-
111
-
112
-
113
-
114
-
115
-
116
-
117
-
118
-
119
-
120
-
121
-
122
-
123
-
124
-
125
-
126
-
127
-
128
-
129
-
130
-
131
-
132
-
133
-
134
-
135
-
136
-
137
-
138
-
139
-
140
-
141
-
142
-
143
-
144
-
145
-
146
-
147
-
148
-
149
-
150
-
151
-
152
-
153
-
154
-
155
-
156
-
157
-
158
-
159
-
160
-
161
-
162
-
163
-
164
-
165
-
166
-
167
-
168
-
169
-
170
-
171
-
172
-
173
-
174
-
175
-
176
-
177
-
178
-
179
-
180
-
181
-
182
-
183
-
184
-
185
-
186
-
187
-
188
-
189
-
190
-
191
-
192
-
193
-
194
-
195
-
196
-
197
-
198
-
199
-
200
-
201
-
202
-
203
-
204
-
205
-
206
-
207
-
208
-
209
-
210
-
211
-
212
-
213
-
214
-
215
-
216
-
217
-
218
-
219
-
220
 |
 |

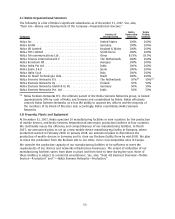
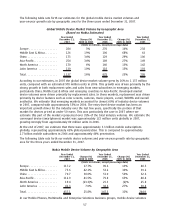
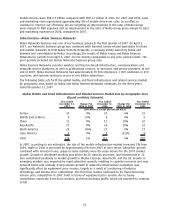
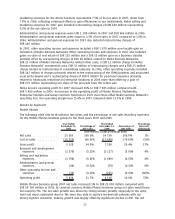
The following table sets forth Nokia Siemens Networks net sales by geographic area for the three
years ended December 31, 2007.
Nokia Siemens Networks Net Sales by Geographic Area*
Year Ended
December 31,
2007
Year Ended
December 31,
2006
Year Ended
December 31,
2005
(EUR millions)
Europe .......................................... 5359 2707 2813
Middle East & Africa ............................... 1515 546 274
China ........................................... 1350 885 695
AsiaPacific ...................................... 3350 1758 1197
North America .................................... 616 758 816
Latin America .................................... 1202 799 762
Total ........................................... 13393 7453 6557
* As of April 1, 2007, Nokia results include those of Nokia Siemens Networks on a fully consolidated
basis. Nokia Siemens Networks, a company jointly owned by Nokia and Siemens, is comprised of
our former Networks business group and Siemens’ carrierrelated operations for fixed and mobile
networks. Accordingly, the results of the Nokia Group and Nokia Siemens Networks for the year
ended December 31, 2007 are not directly comparable to results for the years ended December 31,
2006 and 2005, respectively. Nokia’s 2006 and 2005 results included our former Networks business
group only.
Ongoing factors affecting Nokia Siemens Networks performance in infrastructure
Nokia Siemens Networks performance in the infrastructure business is determined by its ability to
satisfy the competitive and complex requirements of the market and its current and potential
customers. Nokia Siemens Networks will need to continue to leverage and, in some cases, improve its
scale, technology and product portfolio to maintain or improve its position in the market. Nokia
Siemens Networks will also need to achieve the estimated EUR 2 billion in annual cost synergies it is
targeting in order to maintain a competitive cost structure, substantially all of which are targeted to
be achieved by the end of 2008.
Nokia Siemens Networks net sales depend on various developments in the mobile and fixed
infrastructure market, such as network operator investments, the pricing environment, Nokia Siemens
Networks market share and product mix. In developed markets, operator investments are primarily
driven by capacity upgrades—which are driven by greater usage of the networks—both for voice calls
and increasingly for data usage. Also, in developed markets, operator investments are driven by 3G/
WCDMA deployments. The initial deployments of 3G/WCDMA have been largely completed and
additional deployments in 2008 will occur where there is a need for greater capacity. In emerging
markets, the principal factors influencing operator investments are the growth in mobile usage and
the growth in the number of subscribers.
Nokia expects very slight growth in the mobile and fixed infrastructure and related services market in
euro terms in 2008. The market is expected to be driven by continuing subscriber growth, growing
minutes of use and the growth of the services market. Nokia and Nokia Siemens Networks are
targeting that Nokia Siemens Networks will grow faster than the market in 2008.
Nokia Siemens Networks net sales are also impacted by pricing developments. Like our mobile
devices business, the products and solutions offered by Nokia Siemens Networks business are subject
to price erosion over time, largely as a result of technology maturation and competitive forces in the
market. Nokia Siemens Networks net sales are also affected by the product mix—the mix of hardware
62