Nokia 2007 Annual Report Download - page 76
Download and view the complete annual report
Please find page 76 of the 2007 Nokia annual report below. You can navigate through the pages in the report by either clicking on the pages listed below, or by using the keyword search tool below to find specific information within the annual report.
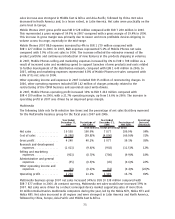
Enterprise Solutions net sales in 2007 compared to 30.9% in 2006 reflecting the growth of the
business as well as effective cost controls.
In 2007, Enterprise Solutions selling and marketing expenses increased by 1% to EUR 308 million
compared with EUR 306 million in 2006. In 2007, selling and marketing expenses represented 14.9%
of Enterprise Solutions net sales compared to 29.7% in 2006 reflecting the growth of the business as
well as effective cost controls.
Other operating income and expenses included a restructuring charge for personnel expenses
primarily related to headcount reductions of EUR 17 million in 2007 and EUR 8 million in 2006.
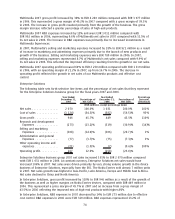
Enterprise Solutions operating profit in 2007 was EUR 267 million compared with an operating loss of
EUR 258 million in 2006, with an operating margin of 12.9% in 2007 and an operating margin of
negative 25.0% in 2006. The increased operating profit and operating margin were primarily driven
by higher net sales, effective operating cost control and higher ASPs of Nokia Eseries devices.
Nokia Siemens Networks
As of April 1, 2007, Nokia results include those of Nokia Siemens Networks on a fully consolidated
basis. Nokia Siemens Networks, a company jointly owned by Nokia and Siemens, is comprised of our
former Networks business group and Siemens’ carrierrelated operations for fixed and mobile
networks. Accordingly, the results of the Nokia Group and Nokia Siemens Networks for the year ended
December 31, 2007 are not directly comparable to the results for the year ended December 31, 2006.
Nokia’s 2006 results included our former Networks business group only.
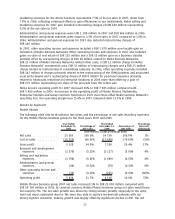
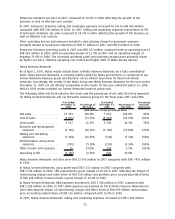
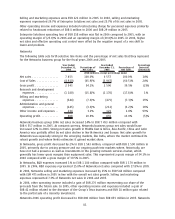
The following table sets forth selective line items and the percentage of net sales that they represent
for Nokia Siemens Networks and our Networks business group for the fiscal years 2007 and 2006.
Year Ended
December 31,
2007
Percentage of
Net Sales
Year Ended
December 31,
2006
Percentage of
Net Sales
Percentage
Increase/
(Decrease)
(EUR millions, except percentage data)
Net sales ................. 13393 100.0% 7 453 100.0% 80%
Cost of Sales .............. (9876) (73.7)% (4 910) (65.9)% 101%
Gross profit ............... 3517 26.3% 2 543 34.1% 38%
Research and development
expenses ............... (2746) (20.5)% (1 180) (15.8)% 133%
Selling and marketing
expenses ............... (1394) (10.4)% (544) (7.3)% 156%
Administrative and general
expenses ............... (701) (5.2)% (245) (3.3)% 186%
Other income and expenses . . 16 0.01% 234 3.1% (93)%
Operating profit............ (1308) (9.8)% 808 10.8%
Nokia Siemens Networks’ net sales were EUR 13 393 million in 2007 compared with EUR 7 453 million
in 2006.
In Nokia Siemens Networks, gross profit was EUR 3 517 million in 2007 compared with
EUR 2 543 million in 2006. This represented a gross margin of 26.3% in 2007 reflecting the impact of
restructuring charges and other items of EUR 318 million and purchase price accounting related items
of EUR 224 million compared with a gross margin of 34.1% in 2006.
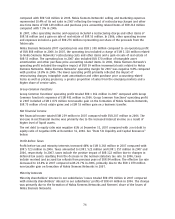
In Nokia Siemens Networks, R&D expenses increased to EUR 2 746 million in 2007 compared with
EUR 1 180 million in 2006. In 2007, R&D expenses represented 20.5% of Nokia Siemens Networks net
sales reflecting the impact of restructuring charges and other items of EUR 439 million and purchase
price accounting related items of EUR 136 million compared with 15.8% in 2006.
In 2007, Nokia Siemens Networks’ selling and marketing expenses increased to EUR 1 394 million
75


