Nokia 2007 Annual Report Download - page 118
Download and view the complete annual report
Please find page 118 of the 2007 Nokia annual report below. You can navigate through the pages in the report by either clicking on the pages listed below, or by using the keyword search tool below to find specific information within the annual report.-
 1
1 -
2
-
3
-
4
-
5
-
6
-
7
-
8
-
9
-
10
-
11
-
12
-
13
-
14
-
15
-
16
-
17
-
18
-
19
-
20
-
21
-
22
-
23
-
24
-
25
-
26
-
27
-
28
-
29
-
30
-
31
-
32
-
33
-
34
-
35
-
36
-
37
-
38
-
39
-
40
-
41
-
42
-
43
-
44
-
45
-
46
-
47
-
48
-
49
-
50
-
51
-
52
-
53
-
54
-
55
-
56
-
57
-
58
-
59
-
60
-
61
-
62
-
63
-
64
-
65
-
66
-
67
-
68
-
69
-
70
-
71
-
72
-
73
-
74
-
75
-
76
-
77
-
78
-
79
-
80
-
81
-
82
-
83
-
84
-
85
-
86
-
87
-
88
-
89
-
90
-
91
-
92
-
93
-
94
-
95
-
96
-
97
-
98
-
99
-
100
-
101
-
102
-
103
-
104
-
105
-
106
-
107
-
 108
108 -
 109
109 -
 110
110 -
 111
111 -
 112
112 -
 113
113 -
 114
114 -
 115
115 -
 116
116 -
 117
117 -
 118
118 -
 119
119 -
 120
120 -
 121
121 -
 122
122 -
 123
123 -
 124
124 -
 125
125 -
 126
126 -
 127
127 -
 128
128 -
129
-
130
-
131
-
132
-
133
-
134
-
135
-
136
-
137
-
138
-
139
-
140
-
141
-
142
-
143
-
144
-
145
-
146
-
147
-
148
-
149
-
150
-
151
-
152
-
153
-
154
-
155
-
156
-
157
-
158
-
159
-
160
-
161
-
162
-
163
-
164
-
165
-
166
-
167
-
168
-
169
-
170
-
171
-
172
-
173
-
174
-
175
-
176
-
177
-
178
-
179
-
180
-
181
-
182
-
183
-
184
-
185
-
186
-
187
-
188
-
189
-
190
-
191
-
192
-
193
-
194
-
195
-
196
-
197
-
198
-
199
-
200
-
201
-
202
-
203
-
204
-
205
-
206
-
207
-
208
-
209
-
210
-
211
-
212
-
213
-
214
-
215
-
216
-
217
-
218
-
219
-
220
 |
 |

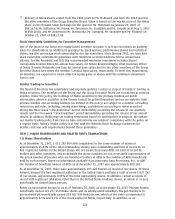
Stock Option
Category
Expiration
Date
Exercise
Price
per
Share
(EUR) Exercisable Unexercisable Exercisable
(3)
Unexercisable
Number of Stock Options
(1)
Total Intrinsic Value of
Stock Options,
December 31, 2007
(EUR)
(2)
Veli Sundba
¨ck............... 2002 A/B December 31, 2007 17.89 — — — —
2003 2Q December 31, 2008 14.95 50 000 — 578 500 —
2004 2Q December 31, 2009 11.79 24 375 5 625 359 044 82 856
2005 2Q December 31, 2010 12.79 22 500 17 500 308 925 240 275
2006 2Q December 31, 2011 18.02 18 750 41 250 159 375 350 625
2007 2Q December 31, 2012 18.39 — 32 000 — 260 160
Anssi Vanjoki ............... 2002 A/B December 31, 2007 17.89 — — — —
2003 2Q December 31, 2008 14.95 — — — —
2004 2Q December 31, 2009 11.79 — 11 250 — 165 713
2005 2Q December 31, 2010 12.79 — 26 250 — 360 413
2006 2Q December 31, 2011 18.02 — 68 750 — 584 375
2007 2Q December 31, 2012 18.39 — 55 000 — 447 150
Kai O
¨ista
¨mo
¨................ 2002 A/B December 31, 2007 17.89 — — — —
2003 2Q December 31, 2008 14.95 727 — 8 411 —
2004 2Q December 31, 2009 11.79 1 250 1 875 18 413 27 619
2005 2Q December 31, 2010 12.79 1 600 5 600 21 968 76 888
2005 4Q December 31, 2010 14.48 3 500 15 750 42 140 189 630
2006 2Q December 31, 2011 18.02 31 250 68 750 265 625 584 375
2007 2Q December 31, 2012 18.39 — 55 000 — 447 150
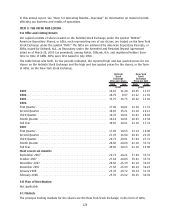
Stock options held by the members
of the Group Executive Board on
December 31, 2007, Total ...... 979299 1714545 11463724 16163936
All outstanding stock option plans
(global plans), Total .......... 20869758 13803554 248800175 139926235
(1)
Number of stock options equals the number of underlying shares represented by the option enti
tlement. Stock options vest over four years: 25% after one year and 6.25% each quarter
thereafter.
(2)
The intrinsic value of the stock options is based on the difference between the exercise price of
the options and the closing market price of Nokia shares on the Helsinki Stock Exchange as at
December 28, 2007 of EUR 26.52.
(3)
For gains realized upon exercise of stock options for the members of the Group Executive Board,
see the table in “—Stock Option Exercises and Settlement of Shares” below.
(4)
From April 1, 2007, Mr. BeresfordWylie has participated in a longterm cash incentive plan spon
sored by Nokia Siemens Networks instead of the longterm equitybased plans of Nokia.
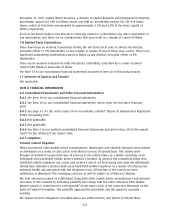
Performance Shares and Restricted Shares
The following table provides certain information relating to performance shares and restricted shares
held by members of the Group Executive Board as at December 31, 2007. These entitlements were
granted pursuant to our performance share plans 2004, 2005, 2006 and 2007 and restricted share
plans 2005, 2006 and 2007. For a description of our performance share and restricted share plans,
please see Note 22 to the consolidated financial statements in Item 18 of this annual report.
Plan Name
(1)
Number of
Performance
Shares at
Threshold
(2)
Number of
Performance
Shares at
Maximum
(2)
Intrinsic Value
December 31,
2007
(3)
(EUR)
Plan
Name
(4)
Number of
Restricted
Shares
Intrinsic Value
December 31,
2007
(5)
(EUR)
Performance Shares
Restricted Shares
OlliPekka Kallasvuo ...... 2004 15 000 35 850 950 742
2005 15 000 45 000 1 193 400 2005 70 000 1 856 400
2006 75 000 300 000 6 552 786 2006 100 000 2 652 000
2007 80 000 320 000 6 571 490 2007 100 000 2 652 000
Robert Andersson ........ 2004 2 600 6 214 164 795
2005 3 000 9 000 238 680 2005 28 000 742 560
2006 20 000 80 000 1 747 410 2006 20 000 530 400
2007 16 000 64 000 1 314 298 2007 25 000 663 000
117