Nokia 2007 Annual Report Download - page 79
Download and view the complete annual report
Please find page 79 of the 2007 Nokia annual report below. You can navigate through the pages in the report by either clicking on the pages listed below, or by using the keyword search tool below to find specific information within the annual report.-
 1
1 -
2
-
3
-
4
-
5
-
6
-
7
-
8
-
9
-
10
-
11
-
12
-
13
-
14
-
15
-
16
-
17
-
18
-
19
-
20
-
21
-
22
-
23
-
24
-
25
-
26
-
27
-
28
-
29
-
30
-
31
-
32
-
33
-
34
-
35
-
36
-
37
-
38
-
39
-
40
-
41
-
42
-
43
-
44
-
45
-
46
-
47
-
48
-
49
-
50
-
51
-
52
-
53
-
54
-
55
-
56
-
57
-
58
-
59
-
60
-
61
-
62
-
63
-
64
-
65
-
66
-
67
-
68
-
 69
69 -
 70
70 -
 71
71 -
 72
72 -
 73
73 -
 74
74 -
 75
75 -
 76
76 -
 77
77 -
 78
78 -
 79
79 -
 80
80 -
 81
81 -
 82
82 -
 83
83 -
 84
84 -
 85
85 -
 86
86 -
 87
87 -
 88
88 -
 89
89 -
90
-
91
-
92
-
93
-
94
-
95
-
96
-
97
-
98
-
99
-
100
-
101
-
102
-
103
-
104
-
105
-
106
-
107
-
108
-
109
-
110
-
111
-
112
-
113
-
114
-
115
-
116
-
117
-
118
-
119
-
120
-
121
-
122
-
123
-
124
-
125
-
126
-
127
-
128
-
129
-
130
-
131
-
132
-
133
-
134
-
135
-
136
-
137
-
138
-
139
-
140
-
141
-
142
-
143
-
144
-
145
-
146
-
147
-
148
-
149
-
150
-
151
-
152
-
153
-
154
-
155
-
156
-
157
-
158
-
159
-
160
-
161
-
162
-
163
-
164
-
165
-
166
-
167
-
168
-
169
-
170
-
171
-
172
-
173
-
174
-
175
-
176
-
177
-
178
-
179
-
180
-
181
-
182
-
183
-
184
-
185
-
186
-
187
-
188
-
189
-
190
-
191
-
192
-
193
-
194
-
195
-
196
-
197
-
198
-
199
-
200
-
201
-
202
-
203
-
204
-
205
-
206
-
207
-
208
-
209
-
210
-
211
-
212
-
213
-
214
-
215
-
216
-
217
-
218
-
219
-
220
 |
 |

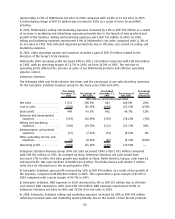
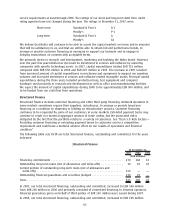
restructuring of the CDMA business and associated asset writedowns. Other operating expenses
included also restructuring charge of EUR 8 million for personnel expenses primarily related to
headcount reductions in Enterprise Solutions in 2006. In 2006, other operating income included a
gain of EUR 276 million representing our share of the proceeds from the Telsim sale. In 2005, other
operating income and expenses included a gain of EUR 61 million relating to the divesture of the
Group’s Tetra business, a gain of EUR 18 million related to the partial sale of a minority investment,
and a gain of EUR 45 million related to qualifying sales and leaseback transactions for real estate. In
2005, Enterprise Solutions recorded a charge of EUR 29 million for personnel expenses and other costs
in connection with the restructuring taken in light of a general downturn in market conditions.
Nokia Group’s operating profit for 2006 increased 18% to EUR 5 488 million compared with EUR 4
639 million in 2005. An increase in Mobile Phones’ and Multimedia’s operating profit in 2006 more
than offset an unchanged operating loss in Enterprise Solutions and an operating profit decline in
Networks. Networks operating profit included the negative impact of EUR 39 million incremental costs
related to Nokia Siemens Networks. Our operating margin was 13.3% in 2006 compared with 13.6%
in 2005.
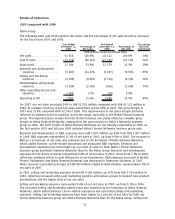
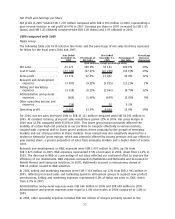
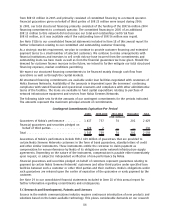
Results by Segments
Mobile Phones
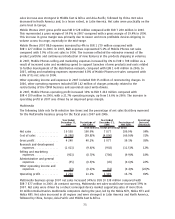
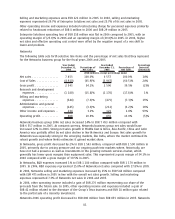
The following table sets forth selective line items and the percentage of net sales that they represent
for the Mobile Phones business group for the fiscal years 2006 and 2005.
Year Ended
December 31,
2006
Percentage of
Net Sales
Year Ended
December 31,
2005
Percentage of
Net Sales
Percentage
Increase/
(Decrease)
(EUR millions, except percentage data)
Net sales ................. 24769 100.0% 20 811 100.0% 19%
Cost of sales .............. (17489) (70.6)% (14 331) (68.9)% 22%
Gross profit ............... 7280 29.4% 6 480 31.1% 12%
Research and development
expenses ............... (1227) (5.0)% (1 245) (6.0)% (1)%
Selling and marketing
expenses ............... (1649) (6.6)% (1 541) (7.4)% 7%
Administrative and general
expenses ............... (79) (0.3)% (68) (0.3)% 16%
Other operating income and
expenses ............... (225) (0.9)% (28) (0.1)%
Operating profit............ 4100 16.6% 3 598 17.3% 14%
Mobile Phones business group 2006 net sales increased 19% to EUR 24 769 million compared with
EUR 20 811 million in 2005. At constant currency, Mobile Phones business group net sales would have
increased by 15%. Net sales growth was driven by strong volume growth, especially in the entry
level, and our ability to capture incremental volumes with our competitive entrylevel product
portfolio and strong logistics. Volume growth was partially offset by declining ASPs. Net sales
increased in all areas and were strongest in Latin America, followed by AsiaPacific, China, Europe,
Middle East & Africa and North America.
Mobile Phones 2006 gross profit was EUR 7 280 million compared with EUR 6 480 million in 2005.
This represented a gross margin of 29.4% in 2006 compared with a gross margin of 31.1% in 2005.
This decline in gross margin reflected a higher proportion of sales of lower priced entry level phones,
driven by strong demand in emerging markets where our share is high and also a lack of broad
acceptance of certain highend products in our portfolio.
Mobile Phones 2006 R&D expenses decreased by 1% to EUR 1 227 million compared with EUR 1
78