Nokia 2007 Annual Report Download - page 56
Download and view the complete annual report
Please find page 56 of the 2007 Nokia annual report below. You can navigate through the pages in the report by either clicking on the pages listed below, or by using the keyword search tool below to find specific information within the annual report.-
 1
1 -
2
-
3
-
4
-
5
-
6
-
7
-
8
-
9
-
10
-
11
-
12
-
13
-
14
-
15
-
16
-
17
-
18
-
19
-
20
-
21
-
22
-
23
-
24
-
25
-
26
-
27
-
28
-
29
-
30
-
31
-
32
-
33
-
34
-
35
-
36
-
37
-
38
-
39
-
40
-
41
-
42
-
43
-
44
-
45
-
 46
46 -
 47
47 -
 48
48 -
 49
49 -
 50
50 -
 51
51 -
 52
52 -
 53
53 -
 54
54 -
 55
55 -
 56
56 -
 57
57 -
 58
58 -
 59
59 -
 60
60 -
 61
61 -
 62
62 -
 63
63 -
 64
64 -
 65
65 -
 66
66 -
67
-
68
-
69
-
70
-
71
-
72
-
73
-
74
-
75
-
76
-
77
-
78
-
79
-
80
-
81
-
82
-
83
-
84
-
85
-
86
-
87
-
88
-
89
-
90
-
91
-
92
-
93
-
94
-
95
-
96
-
97
-
98
-
99
-
100
-
101
-
102
-
103
-
104
-
105
-
106
-
107
-
108
-
109
-
110
-
111
-
112
-
113
-
114
-
115
-
116
-
117
-
118
-
119
-
120
-
121
-
122
-
123
-
124
-
125
-
126
-
127
-
128
-
129
-
130
-
131
-
132
-
133
-
134
-
135
-
136
-
137
-
138
-
139
-
140
-
141
-
142
-
143
-
144
-
145
-
146
-
147
-
148
-
149
-
150
-
151
-
152
-
153
-
154
-
155
-
156
-
157
-
158
-
159
-
160
-
161
-
162
-
163
-
164
-
165
-
166
-
167
-
168
-
169
-
170
-
171
-
172
-
173
-
174
-
175
-
176
-
177
-
178
-
179
-
180
-
181
-
182
-
183
-
184
-
185
-
186
-
187
-
188
-
189
-
190
-
191
-
192
-
193
-
194
-
195
-
196
-
197
-
198
-
199
-
200
-
201
-
202
-
203
-
204
-
205
-
206
-
207
-
208
-
209
-
210
-
211
-
212
-
213
-
214
-
215
-
216
-
217
-
218
-
219
-
220
 |
 |

included in Item 18 of this annual report and “Item 3.D Risk Factors.” Our financial statements and
the financial information discussed below have been prepared in accordance with IFRS.
For the purposes of the discussion under “—Principal Factors Affecting our Results of Operations—
Mobile Devices” and “Item 5.C Research and Development, Patents and Licenses”, our mobile device
net sales and costs include the total net sales and costs of the Mobile Phones and Multimedia business
groups, as well as the Mobile Devices business unit of the Enterprise Solutions business group.
Through December 31, 2007, Nokia reported on the following three device business segments: Mobile
Phones, Multimedia and Enterprise Solutions. As of January 1, 2008, the three device business
segments were replaced by an integrated business segment: Devices & Services. Through March 31,
2007, we also reported on a networks business segment, which was replaced from April 1, 2007 by
Nokia Siemens Networks. For a description of our organizational structure see “Item 4.A—History and
Development of the Company—Organizational Structure.” Business segment data in the following
discussion is prior to intersegment eliminations. See Note 2 to our consolidated financial statements
included in Item 18 of this annual report.
Overview
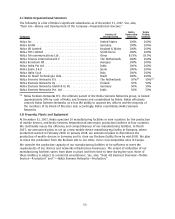
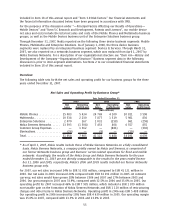
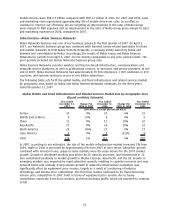
The following table sets forth the net sales and operating profit for our business groups for the three
years ended December 31, 2007.
Net Sales and Operating Profit by Business Group*
Net
Sales
Operating
Profit/(Loss)
Net
Sales
Operating
Profit/(Loss)
Net
Sales
Operating
Profit/(Loss)
2007 2006 2005
Year Ended December 31,
(EUR millions)
Mobile Phones .............. 25083 5434 24769 4100 20811 3598
Multimedia................. 10538 2230 7877 1319 5981 836
Enterprise Solutions ......... 2070 267 1031 (258) 861 (258)
Nokia Siemens Networks ..... 13393 (1308) 7 453 808 6 557 855
Common Group Expenses ..... — 1362 — (481) — (392)
Eliminations................ (26) — (9) — (19) —
Total...................... 51058 7985 41121 5488 34191 4639
* As of April 1, 2007, Nokia results include those of Nokia Siemens Networks on a fully consolidated
basis. Nokia Siemens Networks, a company jointly owned by Nokia and Siemens, is comprised of
our former Networks business group and Siemens’ carrierrelated operations for fixed and mobile
networks. Accordingly, the results of the Nokia Group and Nokia Siemens Networks for the year
ended December 31, 2007 are not directly comparable to the results for the years ended Decem
ber 31, 2006 and 2005, respectively. Nokia’s 2006 and 2005 results included our former Networks
business group only.
For 2007, our net sales increased 24% to EUR 51 058 million, compared to EUR 41 121 million in
2006. Our net sales in 2006 increased 20% compared with EUR 34 191 million in 2005. At constant
currency, net sales would have grown 28% between 2006 and 2007 and 17% between 2005 and
2006. Our gross margin in 2007 was 33.9%, compared with 32.5% in 2006 and 35.0% in 2005. Our
operating profit for 2007 increased 46% to EUR 7 985 million, which included a EUR 1 879 million
nontaxable gain on the formation of Nokia Siemens Networks and EUR 1 110 million of restructuring
charges and other items in Nokia Siemens Networks. Operating profit in 2006 was EUR 5 488 million.
Our operating profit in 2006 increased by 18% from EUR 4 639 million in 2005. Our operating margin
was 15.6% in 2007, compared with 13.3% in 2006 and 13.6% in 2005.
55