Nokia 2007 Annual Report Download - page 73
Download and view the complete annual report
Please find page 73 of the 2007 Nokia annual report below. You can navigate through the pages in the report by either clicking on the pages listed below, or by using the keyword search tool below to find specific information within the annual report.-
 1
1 -
2
-
3
-
4
-
5
-
6
-
7
-
8
-
9
-
10
-
11
-
12
-
13
-
14
-
15
-
16
-
17
-
18
-
19
-
20
-
21
-
22
-
23
-
24
-
25
-
26
-
27
-
28
-
29
-
30
-
31
-
32
-
33
-
34
-
35
-
36
-
37
-
38
-
39
-
40
-
41
-
42
-
43
-
44
-
45
-
46
-
47
-
48
-
49
-
50
-
51
-
52
-
53
-
54
-
55
-
56
-
57
-
58
-
59
-
60
-
61
-
62
-
 63
63 -
 64
64 -
 65
65 -
 66
66 -
 67
67 -
 68
68 -
 69
69 -
 70
70 -
 71
71 -
 72
72 -
 73
73 -
 74
74 -
 75
75 -
 76
76 -
 77
77 -
 78
78 -
 79
79 -
 80
80 -
 81
81 -
 82
82 -
 83
83 -
84
-
85
-
86
-
87
-
88
-
89
-
90
-
91
-
92
-
93
-
94
-
95
-
96
-
97
-
98
-
99
-
100
-
101
-
102
-
103
-
104
-
105
-
106
-
107
-
108
-
109
-
110
-
111
-
112
-
113
-
114
-
115
-
116
-
117
-
118
-
119
-
120
-
121
-
122
-
123
-
124
-
125
-
126
-
127
-
128
-
129
-
130
-
131
-
132
-
133
-
134
-
135
-
136
-
137
-
138
-
139
-
140
-
141
-
142
-
143
-
144
-
145
-
146
-
147
-
148
-
149
-
150
-
151
-
152
-
153
-
154
-
155
-
156
-
157
-
158
-
159
-
160
-
161
-
162
-
163
-
164
-
165
-
166
-
167
-
168
-
169
-
170
-
171
-
172
-
173
-
174
-
175
-
176
-
177
-
178
-
179
-
180
-
181
-
182
-
183
-
184
-
185
-
186
-
187
-
188
-
189
-
190
-
191
-
192
-
193
-
194
-
195
-
196
-
197
-
198
-
199
-
200
-
201
-
202
-
203
-
204
-
205
-
206
-
207
-
208
-
209
-
210
-
211
-
212
-
213
-
214
-
215
-
216
-
217
-
218
-
219
-
220
 |
 |

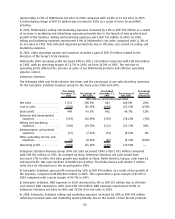
marketing expenses for the device business represented 7.5% of its net sales in 2007, down from
7.9% in 2006, reflecting continued efforts to gain efficiencies in our investments. Nokia selling and
marketing expenses for 2007 also included restructuring charges of EUR 149 million representing
0.3% of the net sales in 2007.
Administrative and general expenses were EUR 1 180 million in 2007 and EUR 666 million in 2006.
Administrative and general expenses were equal to 2.3% of net sales in 2007 compared to 1.6% in
2006. Administrative and general expenses for 2007 also included restructuring charges of
EUR 146 million.
In 2007, other operating income and expenses included a EUR 1 879 million nontaxable gain on
formation of Nokia Siemens Networks. Other operating income and expenses in 2007 also included
gains on sales of real estate of EUR 128 million and a EUR 53 million gain on a business transfer
partially offset by restructuring charges of EUR 58 million related to Nokia Siemens Networks,
EUR 23 million of Nokia Siemens Networks related other costs, a EUR 12 million charge for Nokia
Siemens Networks’ incremental costs, EUR 32 million of restructuring charges and a EUR 25 million
charge related to restructuring of a subsidiary company. In 2006, other operating expenses included
EUR 142 million of charges primarily related to the restructuring of the CDMA business and associated
asset writedowns and a restructuring charge of EUR 8 million for personnel expenses primarily
related to headcount reductions in Enterprise Solutions in 2006 more than offset by a gain of
EUR 276 million representing our share of the proceeds from the Telsim sale.
Nokia Group’s operating profit for 2007 increased 46% to EUR 7 985 million compared with
EUR 5 488 million in 2006. An increase in the operating profit of Mobile Phones, Multimedia,
Enterprise Solution and Group Common Functions in 2007 more than offset Nokia Siemens Network’s
operating loss. Our operating margin was 15.6% in 2007 compared with 13.3% in 2006.
Results by Segments
Mobile Phones
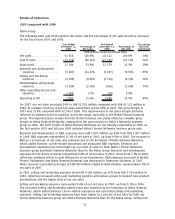
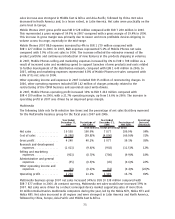
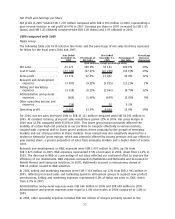
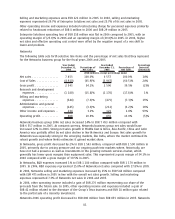
The following table sets forth selective line items and the percentage of net sales that they represent
for the Mobile Phones business group for the fiscal years 2007 and 2006.
Year Ended
December 31,
2007
Percentage of
Net Sales
Year Ended
December 31,
2006
Percentage of
Net Sales
Percentage
Increase/
(Decrease)
(EUR millions, except percentage data)
Net sales ................. 25083 100.0% 24 769 100.0% 1%
Cost of sales .............. (16555) (66.0)% (17 489) (70.6)% (5)%
Gross profit ............... 8528 34.0% 7 280 29.4% 17%
Research and development
expenses ............... (1270) (5.1)% (1 227) (5.0)% 4%
Selling and marketing
expenses ............... (1708) (6.8)% (1 649) (6.6)% 4%
Administrative and general
expenses ............... (84) (0.3)% (79) (0.3)% 6%
Other operating income and
expenses ............... (32) (0.1)% (225) (0.9)% (86)%
Operating profit............ 5434 21.7% 4 100 16.6% 33%
Mobile Phones business group 2007 net sales increased 1% to EUR 25 083 million compared with
EUR 24 769 million in 2006. At constant currency, Mobile Phones business group net sales would have
increased by 5%. The net sales growth was driven by strong volume growth, especially in the entry
level and music optimized devices. We were also able to capture incremental volumes with our
strong logistics execution. Volume growth was largely offset by significant decline in ASP. The net
72