Nissan 2012 Annual Report Download - page 31
Download and view the complete annual report
Please find page 31 of the 2012 Nissan annual report below. You can navigate through the pages in the report by either clicking on the pages listed below, or by using the keyword search tool below to find specific information within the annual report.-
 1
1 -
2
-
3
-
4
-
5
-
6
-
7
-
8
-
9
-
10
-
11
-
12
-
13
-
14
-
15
-
16
-
17
-
18
-
19
-
20
-
 21
21 -
 22
22 -
 23
23 -
 24
24 -
 25
25 -
 26
26 -
 27
27 -
 28
28 -
 29
29 -
 30
30 -
 31
31 -
 32
32 -
 33
33 -
 34
34 -
 35
35 -
 36
36 -
 37
37 -
 38
38 -
 39
39 -
 40
40 -
 41
41 -
42
 |
 |

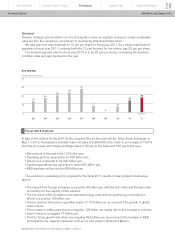
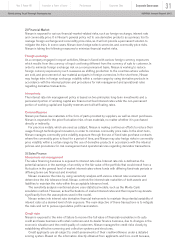
Group Finance
(Inter-Company)
25.5%
Commercial
Paper
0.9%
ABS On B/S
20.9%
L/T Loan 26.6%
Bonds 8%
S/T Loan
3.8%
Equity 10.7%
ABS Off B/S
3.8%
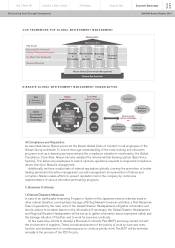
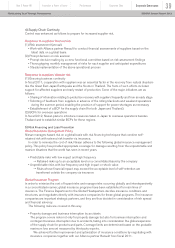
SALES FINANCE BUSINESS
FUNDING SOURCES (As of March, 2012)
Risk Management Measures and Actions
1. Risks Related to Financial Market
1) Liquidity
Automotive
The automotive business must have adequate liquidity to provide for the working capital needs of day-to-
day normal operations, capital investment needs for future expansion and repayment of maturing debt.
Liquidity can be secured through internal cash and cash equivalents or external borrowings. As of the end
of fiscal year 2011 (March 31, 2012), Nissan’s automotive business had 781 billion yen of cash and cash
equivalents (compared with 1,133 billion yen as of March 31, 2011). Cash and cash equivalents balance
was exceptionally high as of the end of fiscal year 2010, as Nissan raised cash following the Great East
Japan Earthquake as a countermeasure against an uncertain environment. In addition to cash, Nissan had
approximately 469 billion yen of committed lines available for drawing as of March 31, 2012.
As for external borrowings, Nissan raises financing through several sources, including bonds
issuance in capital markets, long and short-term loans from banks, commercial paper issuance and
committed credit lines from banks. Nissan has a liquidity risk management policy which is intended to
ensure adequate liquidity for the business while at the same time ensuring we mitigate liquidity risks,
such as unmanageable bunched maturities of debt.
Target liquidity is defined objectively considering several factors, including debt maturity, upcoming
mandatory payments (such as dividends, investments, taxes) and peak operating cash needs. We also
benchmark our liquidity targets with other major Japanese corporations and global auto companies to
ensure we are reasonable in our assumptions.
Sales finance
Nissan operates captive sales finance companies in Japan, the United States, Canada, Mexico, China,
Australia and Thailand. In these countries, banks and other financial institutions are also involved in
providing financing solutions to Nissan’s customers and dealers. Additionally, in Europe and other
regions, RCI Banque and several other banks / financial institutions are providing financing to
Nissan’s customers and dealers.
We monitor the liquidity of sales finance companies on an ongoing basis to ensure we have
adequate liquidity to meet maturing debt and continue operations. As a policy, we target to match the
maturity of liabilities with the maturity of assets wherever possible. In some of the countries where we
operate, long-term capital markets are not developed, and thus it is not always possible to be perfectly
match-funded. Match funding policy allows us to meet maturing debt obligations even in an
environment in which we cannot raise additional debt due to the state of capital markets.
In addition to match funding, we manage liquidity risk at sales financing through several measures,
including keeping adequate liquidity in the form of cash and unutilized committed lines,
unencumbered assets (mainly vehicle loans and leases), liquidity support from auto operations to the
extent we have excess cash in auto operations, diversified funding sources and geographical
diversification of capital markets’ access. As of March 31, 2012, sales finance companies’ liquidity
(cash and unutilized committed lines) was
approximately 860 billion yen. Additionally, we
have a healthy mix of secured (24.7%) and
unsecured and other (75.3%) funding sources
which ensure a stronger balance sheet and
incremental liquidity through utilization of
unencumbered assets.
The pie chart below describes our diversified
funding sources in the sales finance business.
During fiscal year 2011, we were able to raise
new financings through bank loans, asset-
backed securities, asset-backed commercial
paper, commercial paper and bonds reflecting
our diversified access to financing instruments.
Innovation & Power of brandYear 2 Power 88 Performance Corporate Data
Corporate Governance 30
NISSAN Annual Report 2012Maintaining Trust Through Transparency