Nissan 2012 Annual Report Download - page 21
Download and view the complete annual report
Please find page 21 of the 2012 Nissan annual report below. You can navigate through the pages in the report by either clicking on the pages listed below, or by using the keyword search tool below to find specific information within the annual report.-
 1
1 -
2
-
3
-
4
-
5
-
6
-
7
-
8
-
9
-
10
-
 11
11 -
 12
12 -
 13
13 -
 14
14 -
 15
15 -
 16
16 -
 17
17 -
 18
18 -
 19
19 -
 20
20 -
 21
21 -
 22
22 -
 23
23 -
 24
24 -
 25
25 -
 26
26 -
 27
27 -
 28
28 -
 29
29 -
 30
30 -
 31
31 -
32
-
33
-
34
-
35
-
36
-
37
-
38
-
39
-
40
-
41
-
42
 |
 |
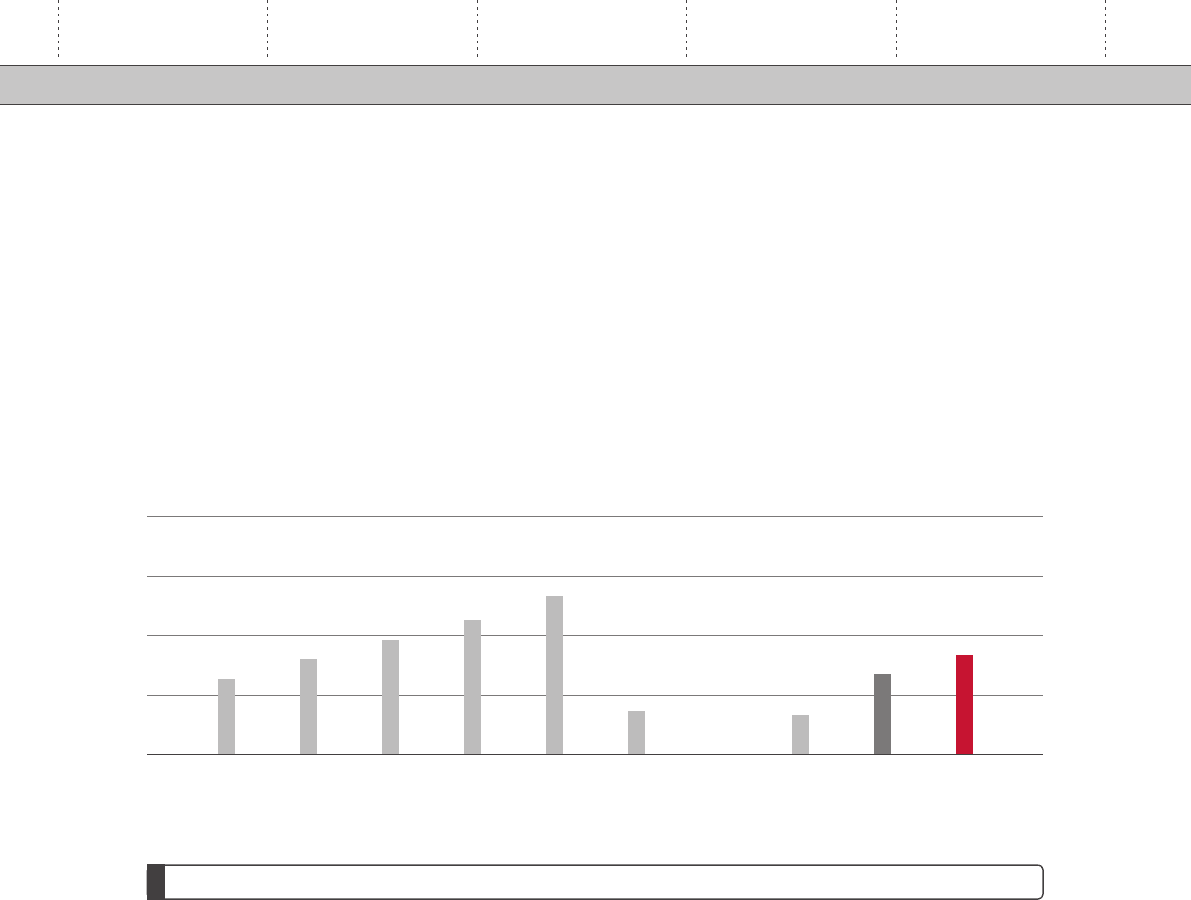
(Dividend per share, in yen)
60
45
30
15
0
’03
19
’05
29
’04
24
’10
10
(Forecast)
’12
25
’11
20
’09
0
’08
11
’07
40
’06
34
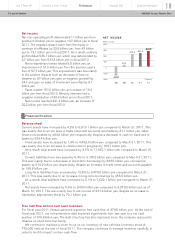
DIVIDEND
Dividend
Nissan’s strategic actions reflect not only its long-term vision as a global company to create sustainable
value but also the company’s commitment to maximizing total shareholder return.
We paid year-end cash dividends of 10 yen per share for fiscal year 2011. As a result, total dividend
payment for fiscal year 2011, combined with the 10 yen dividend for the interim, was 20 yen per share.
The dividend payment plan for fiscal year 2012 is to be 25 yen per share, considering the business
condition, risks and opportunities for the year.
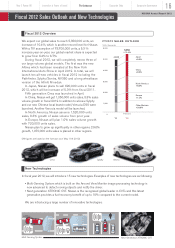
Fiscal 2012 Outlook
In light of the outlook for fiscal 2012, the company filed its forecast with the Tokyo Stock Exchange on
May 11, 2012. Assumptions included retail unit sales of 5,350,000 units, which is an increase of 10.4 %
from the prior year, and foreign-exchange-rates of 82 yen to the dollar and 105 yen to the euro.
• Net revenue is forecast to be 10.3 trillion yen.
• Operating profit is expected to be 700 billion yen.
• Net income is forecast to be 400 billion yen.
• Capital expenditures are expected to reach 550 billion yen.
• R&D expenses will amount to 485 billion yen.
The evolution in operating profit, compared to the fiscal 2011 results, is mainly linked to below key
factors:
• The impact from foreign exchange is a positive 40 billion yen, with the U.S. dollar and Russian ruble
accounting for the majority of this variance.
• The net result of the increase in raw materials/energy costs and our purchasing cost reduction
efforts is a positive 180 billion yen.
• Volume and mix will produce a positive impact of 175 billion yen as a result of the growth in global
sales volume.
• The increase in selling expenses is a negative 125 billion yen mainly due to the increase in volumes.
• Sales finance is a negative 17 billion yen.
• Cost for future growth and others are negative 98.8 billion yen, due mainly to the increase in R&D
and expenses for capacity expansion such as our new plants in Brazil and Mexico.
(All figures for fiscal 2012 are forecasts, as of May 11, 2012.)
Innovation & Power of brandYear 2 Power 88
Performance
Corporate Data Corporate Governance
20
NISSAN Annual Report 2012Financial Review