Nissan 2012 Annual Report Download - page 25
Download and view the complete annual report
Please find page 25 of the 2012 Nissan annual report below. You can navigate through the pages in the report by either clicking on the pages listed below, or by using the keyword search tool below to find specific information within the annual report.-
 1
1 -
2
-
3
-
4
-
5
-
6
-
7
-
8
-
9
-
10
-
11
-
12
-
13
-
14
-
 15
15 -
 16
16 -
 17
17 -
 18
18 -
 19
19 -
 20
20 -
 21
21 -
 22
22 -
 23
23 -
 24
24 -
 25
25 -
 26
26 -
 27
27 -
 28
28 -
 29
29 -
 30
30 -
 31
31 -
 32
32 -
 33
33 -
 34
34 -
 35
35 -
36
-
37
-
38
-
39
-
40
-
41
-
42
 |
 |
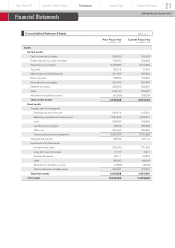
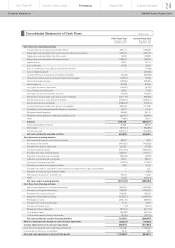
Cash flows from operating activities
Income before income taxes and minority interests
Depreciation and amortization (for fixed assets excluding leased vehicles)
Depreciation and amortization (for other assets)
Depreciation and amortization (for leased vehicles)
Impairment loss
Loss on disaster
Gain on contribution of securities to retirement benefit trust
Gain on negative goodwill
Increase (decrease) in allowance for doubtful receivables
Provision for residual value risk of leased vehicles (net changes)
Interest and dividend income
Interest expense
Loss (gain) on sales of fixed assets
Loss on disposal of fixed assets
Loss (gain) on sales of investment securities
Decrease (increase) in trade notes and accounts receivable
Decrease (increase) in sales finance receivables
Decrease (increase) in inventories
Increase (decrease) in trade notes and accounts payable
Amortization of net retirement benefit obligation at transition
Retirement benefit expenses
Retirement benefit payments made against related accrual
Other
Subtotal
Interest and dividends received
Interest paid
Income taxes paid
Net cash provided by operating activities
Cash flows from investing activities
Net decrease (increase) in short-term investments
Purchases of fixed assets
Proceeds from sales of fixed assets
Purchase of leased vehicles
Proceeds from sales of leased vehicles
Payments of long-term loans receivable
Collection of long-term loans receivable
Purchase of investment securities
Proceeds from sales of investment securities
Proceeds from sales of subsidiaries' shares resulting in changes in the scope of consolidation
Payments for restructuring of domestic dealers
Net decrease (increase) in restricted cash
Other
Net cash used in investing activities
Cash flows from financing activities
Net increase (decrease) in short-term borrowings
Proceeds from long-term borrowings
Proceeds from issuance of bonds
Repayment of long-term borrowings
Redemption of bonds
Proceeds from minority shareholders
Purchase of treasury stock
Repayment of lease obligations
Cash dividends paid
Cash dividends paid to minority shareholders
Net cash provided by (used in) financing activities
Effects of exchange rate changes on cash and cash equivalents
Increase (decrease) in cash and cash equivalents
Cash and cash equivalents at the beginning of the period
Increase due to inclusion in consolidation
Cash and cash equivalents at the end of the period
480,141
404,673
19,554
208,221
10,891
19,785
ー
ー
(3,032
(14,291
(15,596
80,933
(14,407
8,957
(2,422
(131,116
(319,874
(208,924
329,918
10,671
53,668
(33,675
(7,826
876,249
13,625
(81,641
(140,731
667,502
82,847
(281,952
59,120
(601,702
335,727
(29,343
13,251
(12,221
1,846
ー
ー
90,074
11,235
(331,118
360,057
724,529
233,087
(705,607
(394,147
4,116
(13
(87,401
(20,922
(3,124
110,575
(60,315
386,644
761,495
5,314
1,153,453
Current Fiscal Year
From April 1, 2011
To March 31, 2012
Prior Fiscal Year
From April 1, 2010
To March 31, 2011
)
)
)
)
)
)
)
)
)
)
)
)
)
)
)
)
)
)
)
)
)
)
)
)
529,329
364,122
20,852
195,370
12,117
8,245
(7,048)
(24,086)
(23,968)
10,095
(22,950)
87,890
(6,792)
7,106
(10,624)
(89,495)
(432,957)
(70,615)
317,945
10,146
55,141
(62,695)
(2,051)
865,077
23,070
(85,398)
(106,452)
696,297
1,597
(400,623)
27,458
(625,646)
317,211
(4,222)
22,816
(17,340)
6,124
537
(927)
17,336
(29,374)
(685,053)
(536,782)
1,379,490
135,329
(1,034,056)
(88,459)
2,606
(9,015)
(81,118)
(62,748)
(13,704)
(308,457)
(15,630)
(312,843)
1,153,453
261
840,871
Consolidated Statements of Cash Flows
(Millions of yen)
Innovation & Power of brandYear 2 Power 88
Performance
Corporate Data Corporate Governance
24
NISSAN Annual Report 2012Financial Statements