Nissan 2012 Annual Report Download - page 19
Download and view the complete annual report
Please find page 19 of the 2012 Nissan annual report below. You can navigate through the pages in the report by either clicking on the pages listed below, or by using the keyword search tool below to find specific information within the annual report.-
 1
1 -
2
-
3
-
4
-
5
-
6
-
7
-
8
-
 9
9 -
 10
10 -
 11
11 -
 12
12 -
 13
13 -
 14
14 -
 15
15 -
 16
16 -
 17
17 -
 18
18 -
 19
19 -
 20
20 -
 21
21 -
 22
22 -
 23
23 -
 24
24 -
 25
25 -
 26
26 -
 27
27 -
 28
28 -
 29
29 -
30
-
31
-
32
-
33
-
34
-
35
-
36
-
37
-
38
-
39
-
40
-
41
-
42
 |
 |

600
(Billions of yen)
450
300
150
0
−150
−300
’10’08 ’09
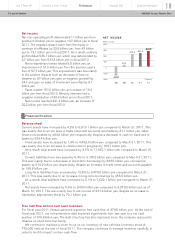
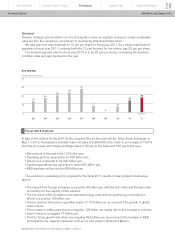
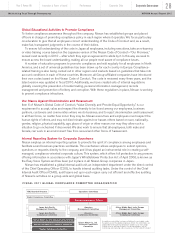
NET INCOME
319.2
(Forecast)
’12
400.0400.0
’11
341.4
–233.7
–233.7
42.4
Net income
Net non-operating profit deteriorated 11 billion yen from
positive 0.3 billion yen to negative 10.7 billion yen in fiscal
2011. The negative impact came from the equity in
earnings of affiliates by 23.9 billion yen, from 43 billion
yen to 19.1 billion yen in fiscal 2011. As a result, ordinary
profit totaled 535.1 billion yen, which was deteriorated by
2.7 billion yen from 537.8 billion yen in fiscal 2010.
Net extraordinary losses totaled 5.8 billion yen, an
improvement of 51.9 billion yen from the previous year’s
loss of 57.7 billion yen. This improvement was due mainly
to the positive impacts such as decrease of loss on
disaster by 9.7 billion yen, gain on negative goodwill by
24.1 and gain on sales of investment securities by 8.1
billion yen.
Taxes totaled 151.5 billion yen, an increase of 19.4
billion yen from fiscal 2010. Minority interests had a
negative contribution of 36.4 billion yen in fiscal 2011.
Net income reached 341.4 billion yen, an increase of
22.2 billion yen from fiscal 2010.
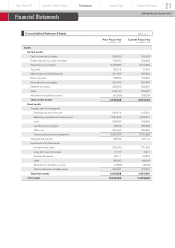
Financial Position
Balance sheet
Current assets have increased by 4.2% to 6,610.1 billion yen compared to March 31, 2011. This
was mainly due to an increase in trade notes and accounts receivable by 81.1 billion yen, sales
finance receivables by 463.5 billion yen respectively, despite a decrease in cash on hand and in
banks by 233.4 billion yen.
Fixed assets have increased by 1.6% to 4,462.0 billion yen compared to March 31, 2011. This
was mainly due to an increase in construction in progress by 156.7 billion yen.
As a result, total assets have increased by 3.1% to 11,072.1 billion yen compared to March 31,
2011.
Current liabilities have decreased by 5.4% to 4,145.2 billion yen compared to March 31, 2011.
This was mainly due to a decrease in short-term borrowings by 348.5 billion yen, commercial
papers by 218.2 billion yen respectively, despite an increase in trade notes and accounts payable
by 195.8 billion yen.
Long-term liabilities have increased by 12.8% to 3,476.8 billion yen compared to March 31,
2011. This was mainly due to an increase in long-term borrowings by 455.5 billion yen.
As a result, total liabilities have increased by 2.1% to 7,622.1 billion yen compared to March 31,
2011.
Net assets have increased by 5.4% to 3,450 billion yen compared to 3,273.8 billion yen as of
March 31, 2011. This was mainly due to net income of 341.4 billion yen, despite an increase in
translation adjustments (loss) by 72.1 billion yen.
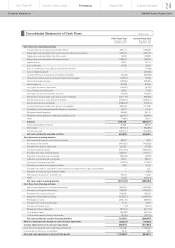
Free cash flow and net cash (auto business)
For fiscal year 2011, Nissan achieved a positive free cash flow of 379.5 billion yen. At the end of
fiscal year 2011, our net automotive debt improved significantly from last year to a net cash
position of 619.8billion yen. The debt structure has also improved, since the company reduced its
reliance on short-term borrowing.
We continue to maintain a close focus on our inventory of new vehicles. Inventory stood at
770,000 units at the end of fiscal 2011. The company continues to manage inventory carefully, in
order to limit its impact on free cash flow.
Innovation & Power of brandYear 2 Power 88
Performance
Corporate Data Corporate Governance
18
NISSAN Annual Report 2012Financial Review