Nissan 2010 Annual Report Download - page 5
Download and view the complete annual report
Please find page 5 of the 2010 Nissan annual report below. You can navigate through the pages in the report by either clicking on the pages listed below, or by using the keyword search tool below to find specific information within the annual report.-
 1
1 -
 2
2 -
 3
3 -
 4
4 -
 5
5 -
 6
6 -
 7
7 -
 8
8 -
 9
9 -
 10
10 -
 11
11 -
 12
12 -
 13
13 -
 14
14 -
 15
15 -
 16
16 -
17
-
18
-
19
-
20
-
21
-
22
-
23
-
24
-
25
-
26
-
27
-
28
-
29
-
30
-
31
-
32
-
33
-
34
-
35
-
36
-
37
-
38
-
39
-
40
-
41
-
42
-
43
-
44
-
45
 |
 |

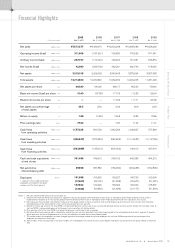
Financial Hi hli hts
gg
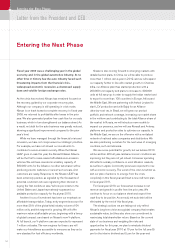
Entering the Next Phase Product Plan Performance
03Annual Report 2010NISSAN MOTOR CO., LTD.
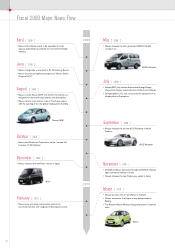
• Nissan’s Eco Series lineup to be expanded to meet
Japan’s preferential tax scheme for environment-friendly
vehicles
• Nissan inaugurates a new plant in St. Petersburg, Russia
• Nissan announces significant progress of “Nissan Green
Program 2010”
• Nissan unveils Nissan LEAF, the world’s first electric car
designed for real-world requirements and affordability
• Nissan returns to its historic roots in Yokohama, Japan,
with the opening of its new global headquarters building
• Nissan and Sumitomo Corporation initiate “second-life”
business for EV batteries
• Nissan releases the new Roox minicar in Japan
• Nissan releases the new-generation NV200 Vanette
compact van
• Nissan-NEC joint venture Automotive Energy Supply
Corporation begins trial production of lithium-ion batteries
• Dongfeng Motor Co., Ltd. announces the expansion of its
Huadu plant in Guangzhou
• Nissan releases the all-new 370Z Roadster in North
America
• Zhengzhou Nissan launches the high-end NT400 Cabstar
light commercial vehicle in China
• Nissan releases the new Fuga luxury sedan in Japan
Notes: 1. Net sales are presented exclusive of consumption tax.
2. Effective from the fiscal 2006, the Company has adopted the Accounting Standard for Presentation of Net Assets in the Balance Sheet (ASBJ Statement No. 5) and the
Implementation Guidance on the Accounting Standard for Presentation of Net Assets in the Balance Sheet (ASBJ Guidance No. 8) in the calculation of net assets.
3. Net income per share has been calculated on the basis of the average number of shares of common stock outstanding during each term and net assets per share have been
calculated based on the total number of shares outstanding at each business year-end.
4. Diluted net income per share for the fiscal 2008 is not presented because a net loss per share was recorded although dilutive securities existed. Diluted net income per share for
the fiscal 2009 is not presented because the Company had no securities with dilutive effects.
5. Price earnings ratio for the fiscal 2008 is not presented because a net loss per share is recorded.
6. Net automotive interest-bearing debt is calculated by subtracting cash and cash equivalents from interest-bearing debt in the automobile and eliminations segment. A negative
figure represents that the ending balance of cash and cash equivalents exceeds that of interest-bearing debt.
7. The number of part-time employees has been changed to present the average number of part-time employees for the fiscal 2008 compared with the year-end part-time
employees for the previous fiscal years.
8. Staff numbers, which are presented as the lower numbers in the “Employees” line, include those of unconsolidated subsidiaries accounted for by the equity method as reference
data.
Millions of yen
Millions of yen
Millions of yen
Millions of yen
Millions of yen
Millions of yen
Yen
Yen
Yen
%
%
Times
Millions of yen
Millions of yen
Millions of yen
Millions of yen
Millions of yen
Number
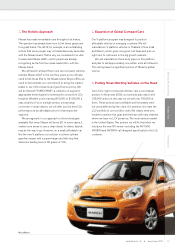
• Nissan launches the all-new March in Thailand
• Nissan announces it will open a new design studio in
Beijing
• The Renault-Nissan Alliance inaugurates plant in Chennai,
India
• Nissan wins an energy conservation prize for its
eco-mode function and navigation-linked speed control
Roox
Nissan LEAF
NV200 Vanette
370Z Roadster
March
Net sales
Operating income (loss)
Ordinary income (loss)
Net income (loss)
Net assets
Total assets
Net assets per share
Basic net income (loss) per share
Diluted net income per share
Net assets as a percentage
of total assets
Return on equity
Price earnings ratio
Cash flows
from operating activities
Cash flows
from investing activities
Cash flows
from financing activities
Cash and cash equivalents
at end of year
Net automotive
interest-bearing debt
Employees
( ) represents the number of part-time
employees not included in the above
numbers as of the fiscal year end
¥9,428,292
871,841
845,872
518,050
3,087,983
11,481,426
753.40
126.94
125.96
26.9
18.66
11.01
757,869
(1,112,755
457,919
404,212
(372,893
162,099
(21,257
165,397
(21,564
)
)
)
)
2005
Mar. 31, 2006
¥10,468,583
776,939
761,051
460,796
3,876,994
12,402,208
862.29
112.33
111.71
28.6
13.89
11.24
1,042,827
(1,114,587
106,912
469,388
(254,638
165,729
(20,607
169,299
(21,177
)
)
)
)
2006
Mar. 31, 2007
¥10,824,238
790,830
766,400
482,261
3,849,443
11,939,482
860.17
117.76
117.56
29.4
13.68
7.00
1,342,284
(867,623
(307,002
584,102
(180,232
159,227
(21,308
163,099
(21,686
)
)
)
)
)
2007
Mar. 31, 2008
¥7,517,277
311,609
207,747
42,390
3,015,105
10,214,820
663.90
10.40
—
26.5
1.59
77.02
1,177,226
(496,532
(663,989
761,495
29,658
151,698
(17,600
157,624
(17,908
)
)
)
)
2009
Mar. 31, 2010
¥8,436,974
(137,921
(172,740
(233,709
2,926,053
10,239,540
644.60
(57.38
—
25.6
(7.62
—
890,726
(573,584
(135,013
746,912
387,882
155,659
(20,107
160,422
(20,649
)
)
)
)
)
)
)
)
)
2008
Mar. 31, 2009For the years ended