Nissan 2010 Annual Report Download - page 24
Download and view the complete annual report
Please find page 24 of the 2010 Nissan annual report below. You can navigate through the pages in the report by either clicking on the pages listed below, or by using the keyword search tool below to find specific information within the annual report.-
 1
1 -
2
-
3
-
4
-
5
-
6
-
7
-
8
-
9
-
10
-
11
-
12
-
13
-
 14
14 -
 15
15 -
 16
16 -
 17
17 -
 18
18 -
 19
19 -
 20
20 -
 21
21 -
 22
22 -
 23
23 -
 24
24 -
 25
25 -
 26
26 -
 27
27 -
 28
28 -
 29
29 -
 30
30 -
 31
31 -
 32
32 -
 33
33 -
 34
34 -
35
-
36
-
37
-
38
-
39
-
40
-
41
-
42
-
43
-
44
-
45
 |
 |
22
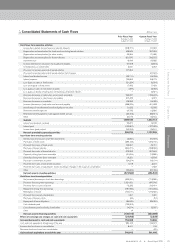
Financial Review
Performance:
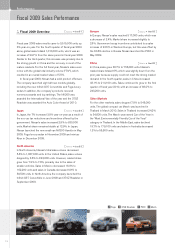
Fiscal 2009 Financial Performance
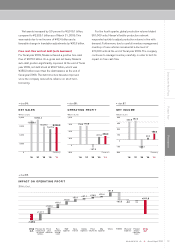
Net sales
For fiscal year 2009, consolidated net revenues decreased
10.9%, to ¥7.517 trillion, which reflected the strong yen
offsetting the increase in sales volume.
Operating profit
Consolidated operating profit totaled ¥311.6 billion,
compared to a negative ¥137.9 billion in fiscal year 2008. In
comparison to last year’s consolidated operating loss, the
variance was due to the following factors:
• Foreign exchange rates movement resulted in a
¥162.5 billion negative impact. By currency, the
majority of this variance was due to the impact of the
U.S. dollar at ¥86 billion, the Russian ruble at ¥28
billion and the Canadian dollar at ¥14 billion.
• Net purchasing cost reduction efforts were a positive
¥215.4 billion. This included the positive impact from
the decrease in raw material and energy costs by
¥81.0 billion.
• Volume and mix was a positive ¥26.9 billion due to the
increase in global sales volume. The fourth quarter was
positive by ¥153.1 billion due to the volume recovery in
most countries.
• The reduction in marketing and sales expenses was a
positive ¥27.1 billion. This was due mainly to savings in
fixed expenses, such as advertising. Incentive spending
was increased in Europe due to its tough market
conditions.
• The provisions for the residual risk on leased vehicles
in North America resulted in a positive variance of
¥141.7 billion, including gains on disposal because of
improved used-car prices in the company’s lease
portfolio.
• R&D costs decreased ¥64.5 billion.
• Sales financing contributed a positive ¥50.1 billion.
This was due mainly to improved borrowing costs
across the globe and lower loss provisions compared
to fiscal year 2008.
• The remaining variance was a positive ¥86.3 billion,
due mainly to savings in fixed expenses, including
manufacturing costs and G&A expenses, as well as
improved profits at the affiliate level.
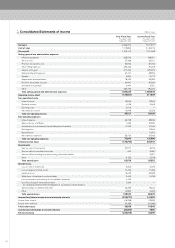
Net income
Net non-operating expenses increased ¥69.1 billion to
¥103.9 billion from ¥34.8 billion in fiscal 2008. The
negative impact came from the decreased equity in earnings
of affiliates by ¥49.2 billion, despite foreign exchange
losses, which deteriorated by ¥15.6 billion to ¥10.6 billion
from last year’s gain of ¥5.0 billion.
Net extraordinary losses totaled ¥66.1 billion, a decrease
of ¥20.1 billion from the previous year’s loss of ¥46 billion.
The positive impact of ¥21.5 billion from the reduction of
special additions to retirement benefits at overseas
subsidiaries was offset by the reduction in gains on sale of
fixed assets of ¥41.6 billion.
Taxes totaled ¥91.5 billion, a decrease of ¥54.6 billion
from fiscal year 2008. Minority interests had a negative
contribution of ¥7.7 billion in fiscal year 2009.
Net income reached ¥42.4 billion, an increase of ¥276.1
billion from fiscal year 2008.
Financial Position
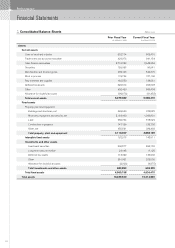
Balance sheet
Current assets increased by 5.7 percent to ¥5,580.4 billion
compared to March 31, 2009. This was mainly due to
increases in trade notes and accounts receivable by ¥212.1
billion and cash on hand and in banks by ¥169.7 billion.
Fixed assets decreased by 6.6% to ¥4,634.4 billion
compared to March 31, 2009. This was mainly due to the
decrease in machinery, equipment and vehicles, which was a
net of ¥168.7 billion.
As a result, total assets decreased by 0.2% to ¥10,214.8
billion compared to March 31, 2009.
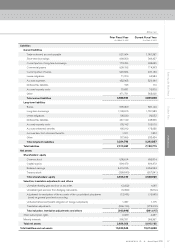
Current liabilities decreased by 3.3 percent to ¥3,856.9
billion compared to March 31, 2009. This was mainly due to
increases in trade notes and accounts payable by ¥379.4
billion, offset by decreases in short-term borrowing by
¥311.5 billion and commercial papers by ¥464.8 billion.
Long-term liabilities increased by 0.5 percent to ¥3,342.9
billion compared to March 31, 2009. This was mainly due to
increases in long-term borrowing by ¥92 billion and
decrease in bonds by ¥88.2 billion.
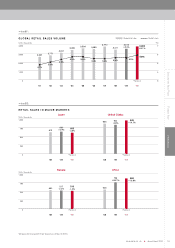
Refer to Chart
05
Refer to Chart
07
Refer to Chart
06
/
08