Nissan 2010 Annual Report Download - page 27
Download and view the complete annual report
Please find page 27 of the 2010 Nissan annual report below. You can navigate through the pages in the report by either clicking on the pages listed below, or by using the keyword search tool below to find specific information within the annual report.-
 1
1 -
2
-
3
-
4
-
5
-
6
-
7
-
8
-
9
-
10
-
11
-
12
-
13
-
14
-
15
-
16
-
 17
17 -
 18
18 -
 19
19 -
 20
20 -
 21
21 -
 22
22 -
 23
23 -
 24
24 -
 25
25 -
 26
26 -
 27
27 -
 28
28 -
 29
29 -
 30
30 -
 31
31 -
 32
32 -
 33
33 -
 34
34 -
 35
35 -
 36
36 -
 37
37 -
38
-
39
-
40
-
41
-
42
-
43
-
44
-
45
 |
 |

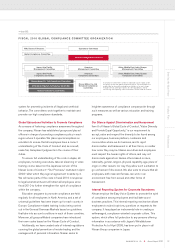
Entering the Next Phase Product Plan Performance
25Annual Report 2010NISSAN MOTOR CO., LTD.
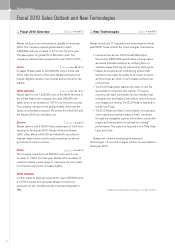
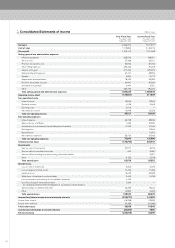
• Net revenues are expected to be ¥8,200 billion.
• Operating income is expected to be ¥350 billion.
• Net income is forecasted to be ¥150 billion.
• R&D expenses will amount to ¥430 billion.
• Capital expenditures are expected to be ¥360 billion.
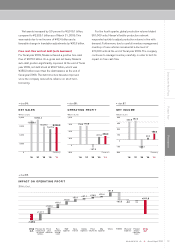
• The increase in raw material and energy costs is
• Marketing and Sales expenses are expected to be a
• Purchasing cost reduction is expected to be a positive
• Volume and mix should be a positive of ¥270 billion
• Others are a negative ¥151.6 billion, due mainly to
Aa3
A1
A2
A3
Baa1
Baa2
Baa3
Ba1
10/02 4/03 10/03 4/04 10/04 4/05 10/05 4/06 10/06 4/07 10/07 4/08 10/08 4/09 10/09 4/10
AA-
A+
A
A-
BBB+
BBB
BBB-
BB+
600
(Billions of yen)
450
300
150
0
(Dividend per share, in yen)
R&I
S&P
Moody’s
’01 ’02 ’03 ’05’04 ’10’09’08’07’06
’01 ’02 ’03 ’05’04 ’10’09’08’07’06
60
45
30
15
0
8
6
4
2
0
(%)
(Forecast)
(Forecast)
262
300
354
448
398 430
386
456
458
465
4.2% 4.4% 4.8%
4.7%
4.6%
5.2%
5.1%
5.4%
4.2%
4.4%
8
14
19
29
24
10
0
11
40
34
CORPORATE RATINGS
Chart
11
:
DIVIDEND
Chart
10
:
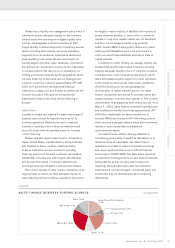
R&D EXPENDITURES % of net revenue
R&D
Chart
09
: