Nissan 2010 Annual Report Download - page 31
Download and view the complete annual report
Please find page 31 of the 2010 Nissan annual report below. You can navigate through the pages in the report by either clicking on the pages listed below, or by using the keyword search tool below to find specific information within the annual report.-
 1
1 -
2
-
3
-
4
-
5
-
6
-
7
-
8
-
9
-
10
-
11
-
12
-
13
-
14
-
15
-
16
-
17
-
18
-
19
-
20
-
 21
21 -
 22
22 -
 23
23 -
 24
24 -
 25
25 -
 26
26 -
 27
27 -
 28
28 -
 29
29 -
 30
30 -
 31
31 -
 32
32 -
 33
33 -
 34
34 -
 35
35 -
 36
36 -
 37
37 -
 38
38 -
 39
39 -
 40
40 -
 41
41 -
42
-
43
-
44
-
45
 |
 |

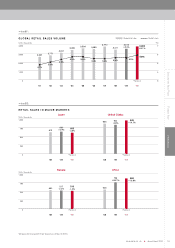
Entering the Next Phase Product Plan Performance
29Annual Report 2010NISSAN MOTOR CO., LTD.
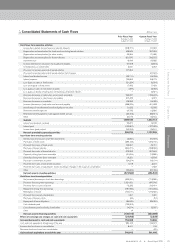
Cash flows from operating activities
Income (loss) before income taxes and minority interests
Depreciation and amortization (for fixed assets excluding leased vehicles)
Depreciation and amortization (for other assets)
Depreciation and amortization (for leased vehicles)
Impairment loss
Increase (decrease) in allowance for doubtful receivables
Unrealized loss on investments
Provision for residual value risk of leased vehicles
Provision for residual value risk of leased vehicles (net changes)
Interest and dividend income
Interest expense
Loss (gain) on sales of fixed assets
Loss on disposal of fixed assets
Loss (gain) on sales of investment securities
Loss (gain) on dilution resulting from restructuring of domestic dealers
Decrease (increase) in trade notes and accounts receivable
Decrease (increase) in sales finance receivables
Decrease (increase) in inventories
Increase (decrease) in trade notes and accounts payable
Amortization of net retirement benefit obligation at transition
Retirement benefit expenses
Retirement benefit payments made against related accrual
Other
Subtotal
Interest and dividends received
Interest paid
Income taxes (paid) refund
Net cash provided by operating activities
Cash flows from investing activities
Net decrease (increase) in short-term investments
Purchases of fixed assets
Proceeds from sales of fixed assets
Purchase of leased vehicles
Proceeds from sales of leased vehicles
Payments of long-term loans receivable
Collection of long-term loans receivable
Purchase of investment securities
Proceeds from sales of investment securities
Proceeds from sales of subsidiaries' shares resulting in changes in the scope of consolidation
Other
Net cash used in investing activities
Cash flows from financing activities
Net increase (decrease) in short-term borrowings
Proceeds from long-term borrowings
Proceeds from issuance of bonds
Repayment of long-term borrowings
Redemption of bonds
Proceeds from minority shareholders
Purchase of treasury stock
Repayment of lease obligations
Cash dividends paid
Cash dividends paid to minority shareholders
Other
Net cash used in financing activities
Effects of exchange rate changes on cash and cash equivalents
Increase (decrease) in cash and cash equivalents
Cash and cash equivalents at beginning of the year
Increase due to inclusion in consolidation
Decrease due to exclusion from consolidation
Cash and cash equivalents at end of the year
141,620
397,553
21,086
242,375
35,682
(4,818
5,252
(31,594
(15,768
108,179
(6,004
17,439
(2,092
(3,921
(196,302
5,079
(16,425
461,428
10,905
63,683
(83,917
92,673
1,242,113
16,126
(107,529
26,516
1,177,226
(77,979
(275,740
49,791
(498,933
367,669
(12,885
16,609
(19,104
3,307
7,922
(57,189
(496,532
(773,286
847,540
316,414
(751,393
(216,936
1,937
(54
(85,424
—
(2,787
—
(663,989
(2,239
14,466
746,912
149
(32
761,495
)
)
)
)
)
)
)
)
)
)
)
)
)
)
)
)
)
)
)
)
)
)
)
)
)
)
(218,771
438,849
25,966
301,547
19,649
27,978
3,047
107,354
(22,711
132,853
(51,324
17,456
(399
—
239,067
377,422
108,393
(488,226
11,023
60,795
(35,403
34,619
1,089,184
22,601
(130,857
(90,202
890,726
(3,681
(386,122
156,261
(664,077
372,952
(21,816
16,321
(24,374
1,618
—
(20,666
(573,584
(622,231
1,561,421
73,336
(781,986
(150,017
1,991
(34
(86,630
(126,303
(4,574
14
(135,013
(27,760
154,369
584,102
8,441
—
746,912
)
)
)
)
)
)
)
)
)
)
)
)
)
)
)
)
)
)
)
)
)
)
)
)
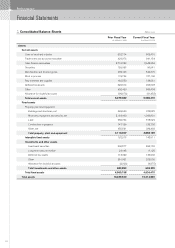
Current Fiscal Year
From April 1, 2009
To March 31, 2010
(Millions of yen)
Prior Fiscal Year
From April 1, 2008
To March 31, 2009
Consolidated Statements of Cash Flows