Nissan 2010 Annual Report Download - page 21
Download and view the complete annual report
Please find page 21 of the 2010 Nissan annual report below. You can navigate through the pages in the report by either clicking on the pages listed below, or by using the keyword search tool below to find specific information within the annual report.-
 1
1 -
2
-
3
-
4
-
5
-
6
-
7
-
8
-
9
-
10
-
 11
11 -
 12
12 -
 13
13 -
 14
14 -
 15
15 -
 16
16 -
 17
17 -
 18
18 -
 19
19 -
 20
20 -
 21
21 -
 22
22 -
 23
23 -
 24
24 -
 25
25 -
 26
26 -
 27
27 -
 28
28 -
 29
29 -
 30
30 -
 31
31 -
32
-
33
-
34
-
35
-
36
-
37
-
38
-
39
-
40
-
41
-
42
-
43
-
44
-
45
 |
 |
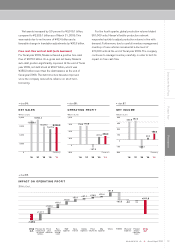
Entering the Next Phase Product Plan Performance
19Annual Report 2010NISSAN MOTOR CO., LTD.
4,000
3,000
2,000
1,000
0
’01 ’02 ’03 ’05’04 ’10’09’08’07’06
(Forecast)
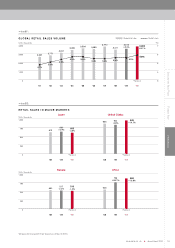
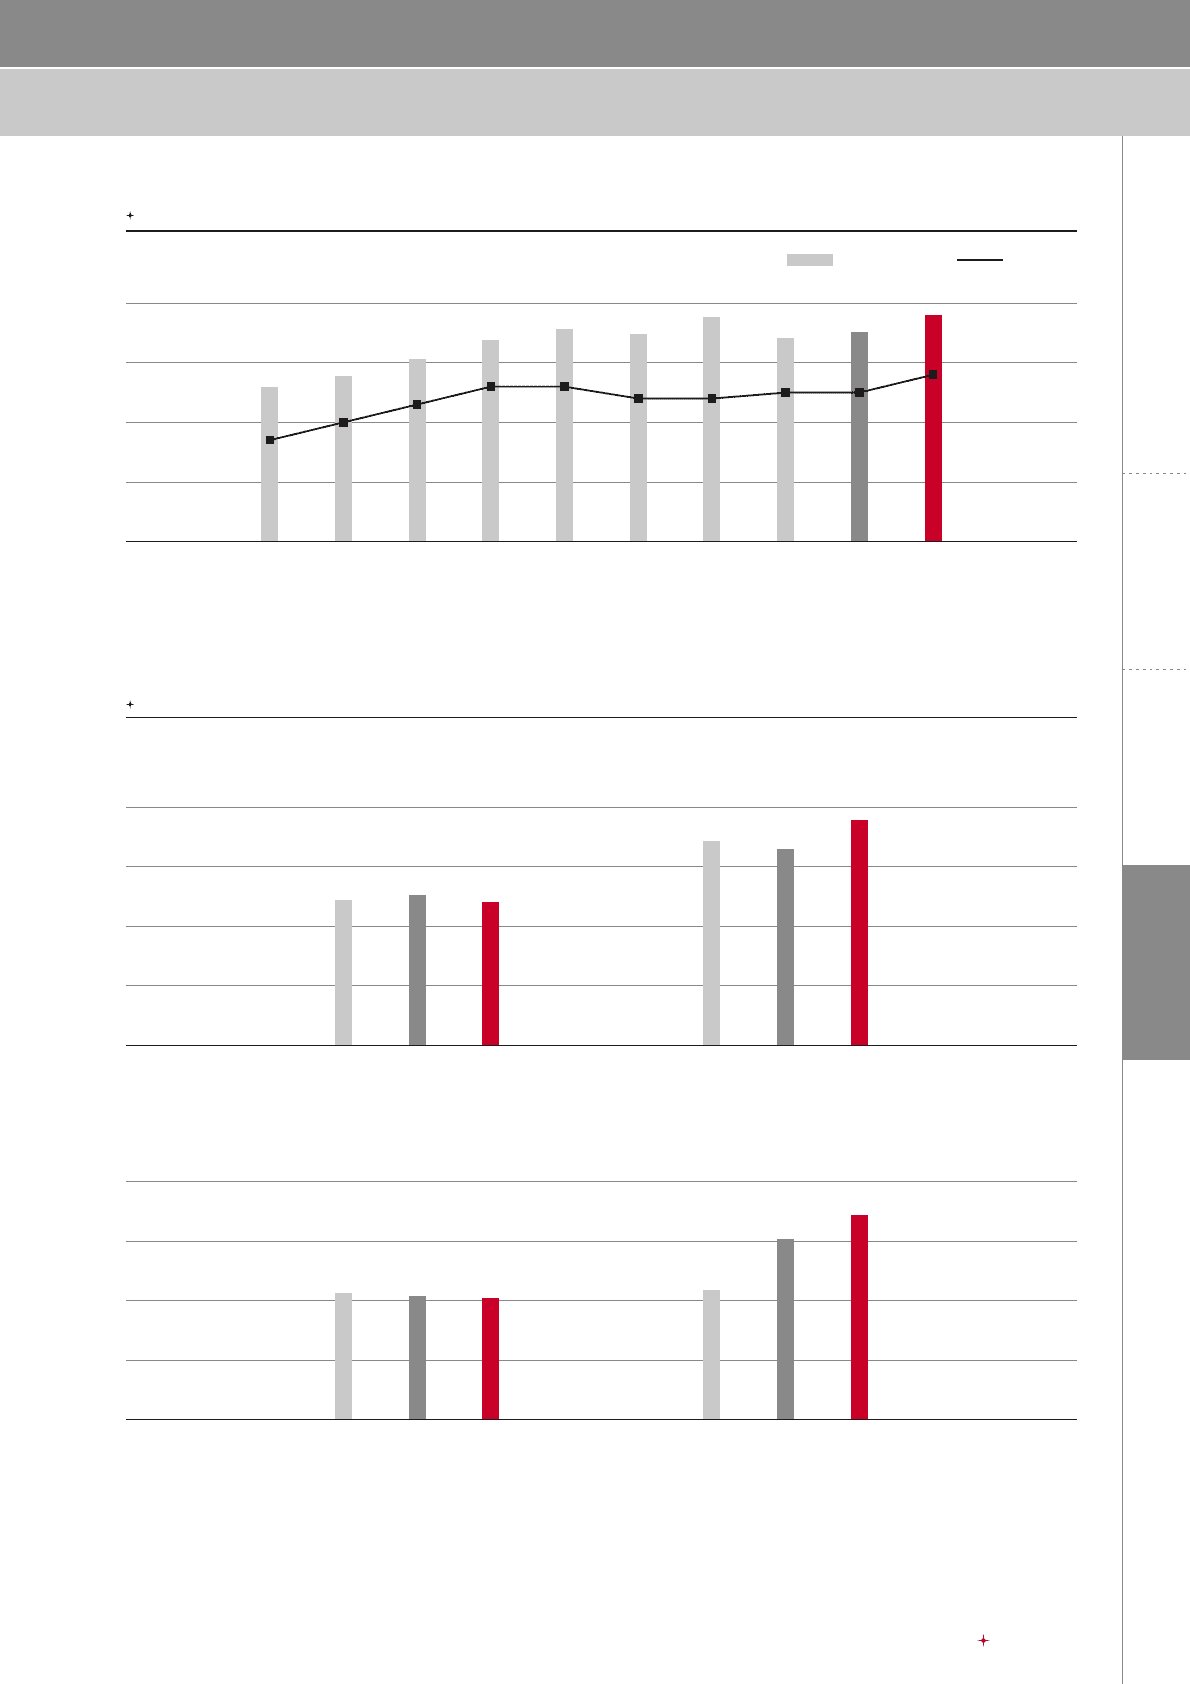
GLOBAL RETAIL SALES VOLUME
Chart
02
:
RETAIL SALES IN MAJOR MARKETS
Chart
01
:
(Units: thousands) (%)
Market share
Global retail sales
7
6
5
4
3
2,597
3,057
3,569
3,389 3,411
3,515
+3.0%
3,770 3,800
+8.1%
3,483
4.7%
5.0%
5.3%
5.6% 5.6% 5.4% 5.4% 5.5% 5.5%
5.8%
1,000
750
500
250
0
1,000
750
500
250
0
’10’09’08’10’09’08
(Forecast)(Forecast)
(Units: thousands)
Japan United States
’10’09’08’10’09’08
(Forecast)(Forecast)
(Units: thousands)
Europe China
612
530
630
+2.9%
517
-2.4%
600
-4.8%
510
-1.3%
856
545
824
-3.8%
756
+38.7%
945
+14.7%
860
+13.8%
(All figures for fiscal year 2010 are forecasts, as of May 12, 2010.)
2,771