Nissan 2010 Annual Report Download - page 25
Download and view the complete annual report
Please find page 25 of the 2010 Nissan annual report below. You can navigate through the pages in the report by either clicking on the pages listed below, or by using the keyword search tool below to find specific information within the annual report.-
 1
1 -
2
-
3
-
4
-
5
-
6
-
7
-
8
-
9
-
10
-
11
-
12
-
13
-
14
-
 15
15 -
 16
16 -
 17
17 -
 18
18 -
 19
19 -
 20
20 -
 21
21 -
 22
22 -
 23
23 -
 24
24 -
 25
25 -
 26
26 -
 27
27 -
 28
28 -
 29
29 -
 30
30 -
 31
31 -
 32
32 -
 33
33 -
 34
34 -
 35
35 -
36
-
37
-
38
-
39
-
40
-
41
-
42
-
43
-
44
-
45
 |
 |
Entering the Next Phase Product Plan Performance
23Annual Report 2010NISSAN MOTOR CO., LTD.
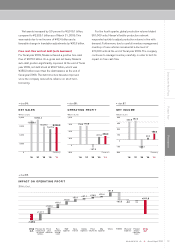
• Foreign exchange rates movement resulted in a
• Net purchasing cost reduction efforts were a positive
• Volume and mix was a positive ¥26.9 billion due to the
• The reduction in marketing and sales expenses was a
fixed expenses, such as advertising. Incentive spending
was increased in Europe due to its tough market
• The provisions for the residual risk on leased vehicles
in North America resulted in a positive variance of
• R&D costs decreased ¥64.5 billion.
• Sales financing contributed a positive ¥50.1 billion.
• The remaining variance was a positive ¥86.3 billion,
due mainly to savings in fixed expenses, including
manufacturing costs and G&A expenses, as well as
Net non-operating expenses increased ¥69.1 billion to
of affiliates by ¥49.2 billion, despite foreign exchange
Net extraordinary losses totaled ¥66.1 billion, a decrease
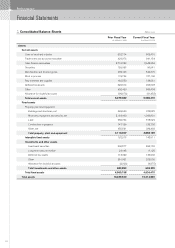
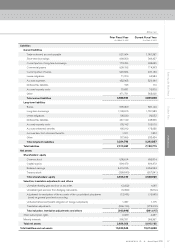
Net assets increased by 3.0 percent to ¥3,015.1 billion,
compared to ¥2,926.1 billion as of March 31, 2009. This
was mainly due to net income of ¥42.4 billion and a
favorable change in translation adjustments by ¥30.3 billion.
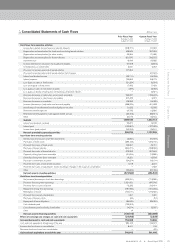
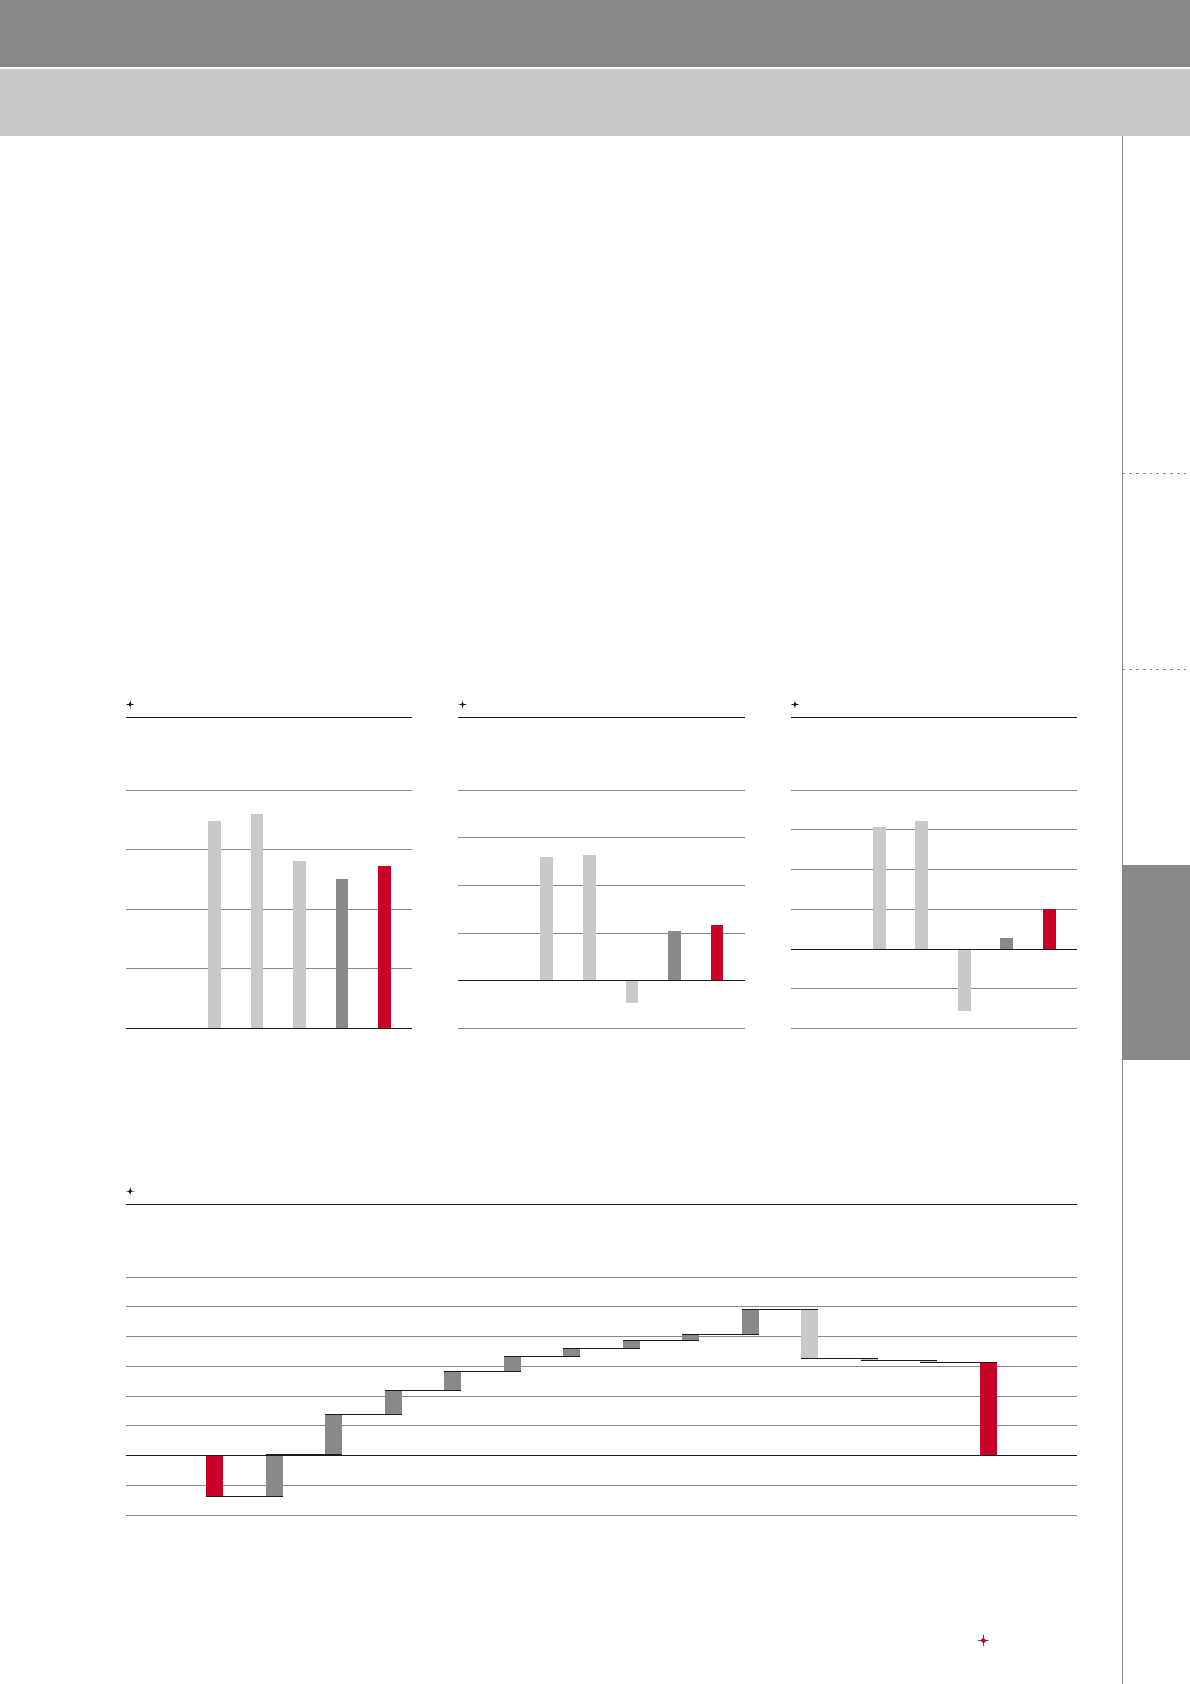
Free cash flow and net debt (auto business)
For fiscal year 2009, Nissan achieved a positive free cash
flow of ¥375.5 billion. On a gross and net basis, Nissan’s
auto debt position significantly improved. At the end of fiscal
year 2009, net debt stood at ¥29.7 billion, which was
¥358.2 billion lower than the debt balance at the end of
fiscal year 2008. The debt structure has also improved,
since the company reduced its reliance on short-term
borrowing.
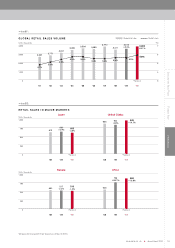
For the fourth quarter, global production volume totaled
951,000 units. Nissan’s flexible production network
responded quickly to adjust production volume in line with
demand. Furthermore, due to careful inventory management,
inventory of new vehicles remained at a low level of
470,000 units at the end of fiscal year 2009. The company
continues to manage inventory carefully, in order to limit its
impact on free cash flow.
12,000
(Billions of yen)
9,000
6,000
3,000
0
(Billions of yen)
’06 ’10’07 ’08 ’09
FY08
O.P.
FY09
O.P.
(Forecast)
Chart
08
:
IMPACT ON OPERATING PROFIT
Chart
05
:
NET SALES
Purch.
cost
reduction
Mfg.
expenses
Price/
volume mix
Provision for
residual risk
on leased
vehicles
Sales
finance OthersRaw
material
/energy
costs
Selling
expenses
R&D
expenses Warranty
expenses
FOREX Product
enrich./
regulatory
costs
600
(Billions of yen)
450
300
150
0
-150
-300
’06 ’10’07 ’08 ’09
(Forecast)
Chart
07
:
NET INCOME
1,200
(Billions of yen)
900
600
0
300
-300
’06 ’10’07 ’08 ’09
(Forecast)
Chart
06
:
OPERATING PROFIT
10,468.6
8,200.0
10,824.2
8,437.0
7,517.3
460.8
150.0
482.3
-233.7
42.4
776.9
350.0
790.8
-137.9
311.6
-137.9
+311.6
+141.7
+134.4
+81.0
+50.1 +27.1 +26.9
+64.5
+20.4
+81.8
-162.5 -8.8 -7.1