Konica Minolta 2000 Annual Report Download - page 31
Download and view the complete annual report
Please find page 31 of the 2000 Konica Minolta annual report below. You can navigate through the pages in the report by either clicking on the pages listed below, or by using the keyword search tool below to find specific information within the annual report.-
 1
1 -
2
-
3
-
4
-
5
-
6
-
7
-
8
-
9
-
10
-
11
-
12
-
13
-
14
-
15
-
16
-
17
-
18
-
19
-
20
-
 21
21 -
 22
22 -
 23
23 -
 24
24 -
 25
25 -
 26
26 -
 27
27 -
 28
28 -
 29
29 -
 30
30 -
 31
31 -
 32
32 -
 33
33 -
 34
34 -
 35
35 -
 36
36
 |
 |

KONICA 29
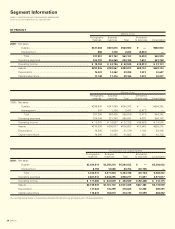
BY REGION
Millions of yen
North Asia Elimination
Japan America Europe and Other Total & corporate Consolidation
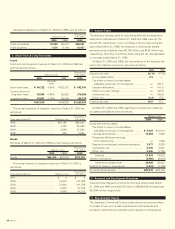
2000: Net sales
Outside .................................................... ¥332,649 ¥129,152 ¥78,079 ¥21,019 ¥560,900 ¥ — ¥560,900
Intersegment ........................................... 106,253 7,406 869 12,755 127,285 (127,285) —
Total ..................................................... 438,903 136,558 78,949 33,774 688,186 (127,285) 560,900
Operating expenses..................................... 405,206 131,520 78,259 32,946 647,933 (120,164) 527,769
Operating income ........................................ ¥ 33,697 ¥ 5,037 ¥ 689 ¥ 828 ¥ 40,252 ¥ (7,121) ¥ 33,131
Assets.......................................................... ¥342,434 ¥ 97,036 ¥42,037 ¥14,151 ¥495,659 ¥ 54,044 ¥549,703
Millions of yen
North Asia Elimination
Japan America Europe and Other Total & corporate Consolidation
1999: Net sales
Outside .................................................... ¥328,570 ¥150,377 ¥86,006 ¥19,389 ¥584,342 ¥ — ¥584,342
Intersegment ........................................... 124,749 8,347 893 18,642 152,631 (152,631) —
Total ..................................................... 453,319 158,724 86,899 38,031 736,973 (152,631) 584,342
Operating expenses..................................... 438,414 155,402 86,421 38,061 718,298 (148,531) 569,767
Operating income (loss)............................... ¥ 14,905 ¥ 3,322 ¥ 478 ¥ (30) ¥ 18,675 ¥ (4,100) ¥ 14,575
Assets.......................................................... ¥350,203 ¥132,233 ¥53,511 ¥12,818 ¥548,765 ¥ 40,436 ¥589,201
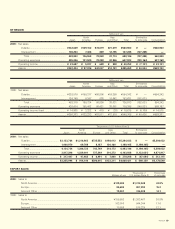
Thousands of U.S. dollars (Note 2)
North Asia Elimination
Japan America Europe and Other Total & corporate Consolidation
2000: Net sales
Outside.......................................... $3,133,764 $1,216,963 $735,553 $198,012 $5,284,032 $ — $5,284,032
Intersegment................................. 1,000,970 69,769 8,187 120,160 1,199,105 (1,199,105) —
Total........................................... 4,134,734 1,286,732 743,749 318,172 6,483,146 (1,199,105) 5,284,032
Operating expenses .......................... 3,817,296 1,239,001 737,249 310,372 6,103,938 (1,132,021) 4,971,917
Operating income.............................. $ 317,447 $ 47,462 $ 6,491 $ 7,800 $ 379,208 $ (67,084) $ 312,115
Assets................................................ $3,225,944 $ 914,140 $396,015 $133,311 $4,669,421 $ 509,129 $5,178,549
EXPORT SALES
Thousands of Percentage
Millions of yen U.S. dollars (Note 2) of net sales
2000: Sales to
North America............................................................................................................ ¥139,380 $1,313,048 24.8%
Europe........................................................................................................................ 85,694 807,292 15.3%
Asia and Other ........................................................................................................... 79,001 744,239 14.1%
1999: Sales to
North America............................................................................................................ ¥156,583 $1,283,467 26.8%
Europe........................................................................................................................ 103,010 844,344 17.6%
Asia and Other ........................................................................................................... 70,556 578,328 12.1%