Konica Minolta 2000 Annual Report Download - page 30
Download and view the complete annual report
Please find page 30 of the 2000 Konica Minolta annual report below. You can navigate through the pages in the report by either clicking on the pages listed below, or by using the keyword search tool below to find specific information within the annual report.-
 1
1 -
2
-
3
-
4
-
5
-
6
-
7
-
8
-
9
-
10
-
11
-
12
-
13
-
14
-
15
-
16
-
17
-
18
-
19
-
 20
20 -
 21
21 -
 22
22 -
 23
23 -
 24
24 -
 25
25 -
 26
26 -
 27
27 -
 28
28 -
 29
29 -
 30
30 -
 31
31 -
 32
32 -
 33
33 -
 34
34 -
 35
35 -
 36
36
 |
 |

28 KONICA
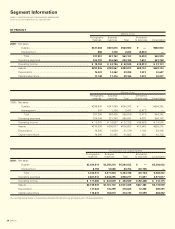
Segment Information
KONICA CORPORATION AND CONSOLIDATED SUBSIDIARIES
For the fiscal years ended March 31, 2000 and 1999
BY PRODUCT
Millions of yen
Photographic Business Elimination
materials machines Total & corporate Consolidation
2000: Net sales
Outside...................................................................................... ¥321,084 ¥239,816 ¥560,900 ¥ — ¥560,900
Intersegment............................................................................. 866 1,336 2,203 (2,203) —
Total....................................................................................... 321,951 241,152 563,103 (2,203) 560,900
Operating expenses ...................................................................... 303,792 216,365 520,158 7,610 527,769
Operating income.......................................................................... ¥ 18,158 ¥ 24,786 ¥ 42,945 ¥ (9,813) ¥ 33,131
Assets ........................................................................................... ¥291,906 ¥189,067 ¥480,973 ¥68,730 ¥549,703
Depreciation .................................................................................. 15,023 14,362 29,385 1,301 30,687
Capital expenditure........................................................................ 11,748 17,416 29,164 1,072 30,237
Millions of yen
Photographic Business Elimination
materials machines Total & corporate Consolidation
1999: Net sales
Outside...................................................................................... ¥336,643 ¥247,699 ¥584,342 ¥ — ¥584,342
Intersegment............................................................................. 747 1,730 2,477 (2,477) —
Total....................................................................................... 337,390 249,429 586,819 (2,477) 584,342
Operating expenses ...................................................................... 334,349 231,342 565,691 4,076 569,767
Operating income.......................................................................... ¥ 3,041 ¥ 18,087 ¥ 21,128 ¥ (6,553) ¥ 14,575
Assets ........................................................................................... ¥310,036 ¥206,617 ¥516,653 ¥72,549 ¥589,201
Depreciation .................................................................................. 16,545 14,834 31,379 1,109 32,488
Capital expenditure........................................................................ 16,568 25,295 41,863 839 42,702
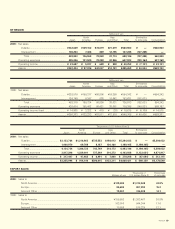
Thousands of U.S. dollars (Note 2)
Photographic Business Elimination
materials machines Total & corporate Consolidation
2000: Net sales
Outside................................................................................ $3,024,814 $2,259,218 $5,284,032 $ — $5,284,032
Intersegment....................................................................... 8,158 12,586 20,754 (20,754) —
Total................................................................................. 3,032,972 2,271,804 5,304,786 (20,754) 5,284,032
Operating expenses ................................................................ 2,861,912 2,038,295 4,900,217 71,691 4,971,917
Operating income.................................................................... $ 171,060 $ 233,509 $ 404,569 $ (92,445) $ 312,115
Assets ..................................................................................... $2,749,939 $1,781,130 $4,531,069 $647,480 $5,178,549
Depreciation ............................................................................ 141,526 135,299 276,825 12,256 289,091
Capital expenditure.................................................................. 110,674 164,070 274,743 10,099 284,852
The accompanying Notes to Consolidated Financial Statements are an integral part of these statements.