Konica Minolta 2000 Annual Report Download - page 3
Download and view the complete annual report
Please find page 3 of the 2000 Konica Minolta annual report below. You can navigate through the pages in the report by either clicking on the pages listed below, or by using the keyword search tool below to find specific information within the annual report.-
 1
1 -
 2
2 -
 3
3 -
 4
4 -
 5
5 -
 6
6 -
 7
7 -
 8
8 -
 9
9 -
 10
10 -
 11
11 -
 12
12 -
 13
13 -
 14
14 -
15
-
16
-
17
-
18
-
19
-
20
-
21
-
22
-
23
-
24
-
25
-
26
-
27
-
28
-
29
-
30
-
31
-
32
-
33
-
34
-
35
-
36
 |
 |
KONICA 1
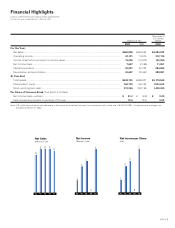
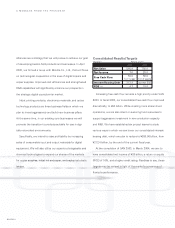
Financial Highlights
KONICA CORPORATION AND CONSOLIDATED SUBSIDIARIES
For the fiscal years ended March 31, 2000 and 1999
Thousands of
U.S. dollars
Millions of yen (Note)
2000 1999 2000
For the Year:
Net sales ............................................................................................................................................... ¥560,900 ¥584,342 $5,284,032
Operating income.................................................................................................................................. 33,131 14,575 312,115
Income (loss) before provision for income taxes .................................................................................. 15,206 (10,872) 143,250
Net income (loss) .................................................................................................................................. 7,627 (3,166) 71,851
Capital expenditure ............................................................................................................................... 30,237 42,702 284,852
Depreciation and amortization............................................................................................................... 30,687 32,488 289,091
At Year-End:
Total assets........................................................................................................................................... ¥549,703 ¥589,201 $5,178,549
Shareholders’ equity ............................................................................................................................. 162,793 158,742 1,533,613
Short- and long-term debt ..................................................................................................................... 212,364 242,199 1,428,300
Per Share of Common Stock (Yen and U.S. Dollars):
Net income (loss)—primary................................................................................................................... ¥ 21.3 ¥ (8.9) $ 0.20
Cash dividends applicable to earnings of the year ................................................................................ 10.0 10.0 0.09
Note: U.S. dollar amounts above and elsewhere in this report are translated from yen, for convenience only, at the rate of ¥106.15=US$1, the approximate exchange rate
prevailing at March 31, 2000.
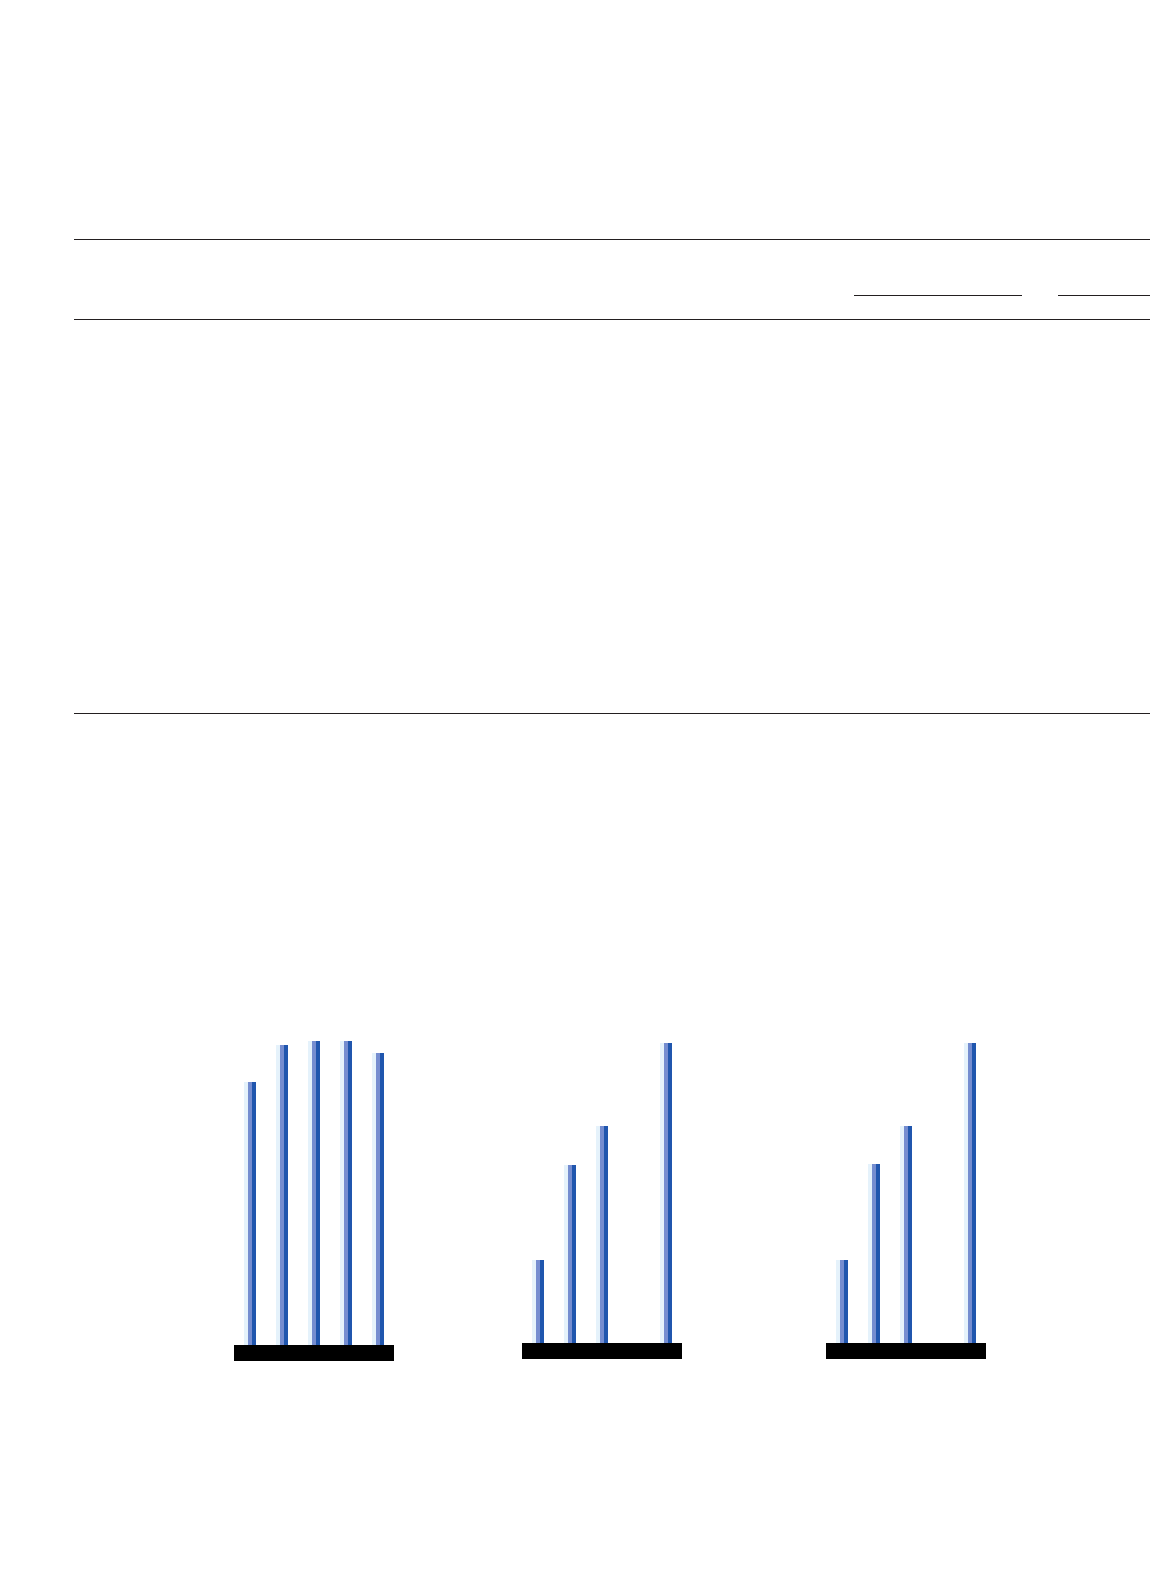
2.1
4.5
5.5
–3.2
7.6
’96 ’97 ’98 ’99 ’00
Net Income
(Billions of yen)
5.9
12.7
15.4
–8.9
21.3
’96 ’97 ’98 ’99 ’00
Net Income per Share
(Yen)
505
578
584
584
561
’96 ’97 ’98 ’99 ’00
Net Sales
(Billions of yen)
Note: Net income for 1999
was –¥3.2 billion.
Note: Net income per share
for 1999 was –¥8.9.