Konica Minolta 2000 Annual Report Download - page 27
Download and view the complete annual report
Please find page 27 of the 2000 Konica Minolta annual report below. You can navigate through the pages in the report by either clicking on the pages listed below, or by using the keyword search tool below to find specific information within the annual report.-
 1
1 -
2
-
3
-
4
-
5
-
6
-
7
-
8
-
9
-
10
-
11
-
12
-
13
-
14
-
15
-
16
-
 17
17 -
 18
18 -
 19
19 -
 20
20 -
 21
21 -
 22
22 -
 23
23 -
 24
24 -
 25
25 -
 26
26 -
 27
27 -
 28
28 -
 29
29 -
 30
30 -
 31
31 -
 32
32 -
 33
33 -
 34
34 -
 35
35 -
 36
36
 |
 |

KONICA 25
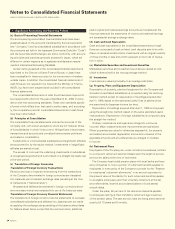
Another pension plan provides for a portion of the retirement bene-
fits, the past service cost of which is being amortized over a period
of 20 years.
Employees of consolidated domestic subsidiaries are generally
covered by unfunded retirement benefit programs. Several of the
domestic subsidiaries have funded pension plans to cover a portion
of the retirement benefit payments.
(i) Income Taxes
Income taxes of the Company and its domestic subsidiaries consist
of corporate income taxes, local inhabitants taxes and enterprise
taxes. Deferred income taxes are provided for in respect of temporary
differences between the tax basis of assets and liabilities and those
as reported in the financial statements. The Company also provides
for the anticipated tax effect of future remittances of retained earn-
ings from overseas subsidiaries and affiliated companies.
( j) Research and Development Expenses
Expenses for research and development activities are charged to
income as incurred.
(k) Per Share Data
Net income per share of common stock has been computed based on
the weighted average number of shares outstanding during the year.
Cash dividends per share shown for each year in the accompany-
ing consolidated statements are dividends declared as applicable to
the respective years.
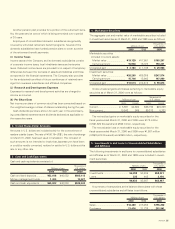
2. United States Dollar Amounts
Amounts in U.S. dollars are included solely for the convenience of
readers outside Japan. The rate of ¥106.15=US$1, the rate of exchange
on March 31, 2000, has been used in translation. The inclusion of
such amounts is not intended to imply that Japanese yen have been
or could be readily converted, realized or settled in U.S. dollars at this
rate or any other rate.
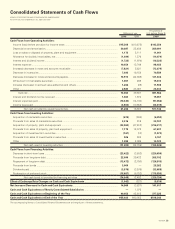
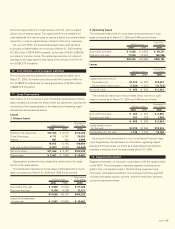
3. Cash and Cash Equivalents
Cash and cash equivalents consisted of:
Thousands of
Millions of yen U.S. dollars
2000 1999 2000
Cash and bank deposits.............. ¥53,618 ¥40,053 $505,115
Money management funds ........ 1,404 —13,227
Cash and cash equivalents ......... ¥55,022 ¥40,053 $518,342
4. Marketable Securities
The aggregate cost and market value of marketable securities included
in investment securities as of March 31, 2000 and 1999 were as follows:
Thousands of
Millions of yen U.S. dollars
2000 1999 2000
Marketable securities
included in current assets:
Market value........................... ¥19,129 ¥17,861 $180,207
Carrying amount ..................... 15,946 16,723 150,221
Unrealized gain ........................... ¥ 3,183 ¥ 1,138 $ 29,986
Investment securities:
Market value........................... ¥26,280 ¥26,358 $247,574
Carrying amount ..................... 15,706 13,943 147,960
Unrealized gain ........................... ¥10,574 ¥12,415 $ 99,614
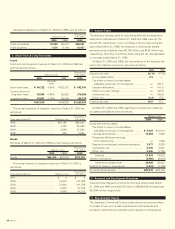
Gross unrealized gains and losses pertaining to marketable equity
securities as of March 31, 2000 were as follows:
Thousands of
Millions of yen U.S. dollars
Gains Losses Gains Losses
Current............................. ¥ 5,961 ¥2,660 $56,156 $25,059
Non-current...................... 10,542 566 99,312 5,332
The net realized gains on marketable equity securities for the
fiscal years ended March 31, 2000 and 1999 were ¥172 million
(US$1,620 thousand) and ¥946 million, respectively.
The net valuation loss on marketable equity securities for the
fiscal years ended March 31, 2000 and 1999 were ¥1,657 million
(US$15,610 thousand) and ¥269 million, respectively.
5. Investments in and Loans to Unconsolidated Subsidiaries
and Affiliates
The following investments in and loans to unconsolidated subsidiaries
and affiliates as of March 31, 2000 and 1999 were included in invest-
ment securities:
Thousands of
Millions of yen U.S. dollars
2000 1999 2000
Investments.................................... ¥6,298 ¥3,205 $59,331
Loans .............................................. 335 442 3,156
........................................................ ¥6,633 ¥3,647 $62,487
A summary of transactions at the balance sheet dates with these
unconsolidated subsidiaries and affiliates is as follows:
Thousands of
Millions of yen U.S. dollars
2000 1999 2000
Sales........................................... ¥16,480 ¥18,256 $155,252
Purchases................................... 21,436 21,739 201,941