Konica Minolta 2000 Annual Report Download - page 28
Download and view the complete annual report
Please find page 28 of the 2000 Konica Minolta annual report below. You can navigate through the pages in the report by either clicking on the pages listed below, or by using the keyword search tool below to find specific information within the annual report.-
 1
1 -
2
-
3
-
4
-
5
-
6
-
7
-
8
-
9
-
10
-
11
-
12
-
13
-
14
-
15
-
16
-
17
-
 18
18 -
 19
19 -
 20
20 -
 21
21 -
 22
22 -
 23
23 -
 24
24 -
 25
25 -
 26
26 -
 27
27 -
 28
28 -
 29
29 -
 30
30 -
 31
31 -
 32
32 -
 33
33 -
 34
34 -
 35
35 -
 36
36
 |
 |

26 KONICA
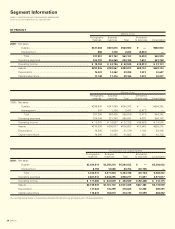
Transaction balances as of March 31, 2000 and 1999 were as follows:
Thousands of
Millions of yen U.S. dollars
2000 1999 2000
Trade receivables.......................... ¥7,282 ¥6,019 $68,601
Trade payables.............................. 7,530 6,104 70,937
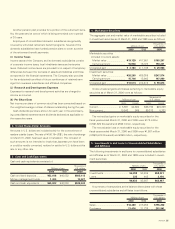
6. Short-Term & Long-Term Debt
Loans
Short-term and long-term loans as of March 31, 2000 and 1999 are
summarized as follows:
Thousands of
Millions of yen U.S. dollars
2000 1999 2000
(Interest
rate)
Short-term loans...... ¥ 94,722 4.51% ¥122,212 $ 892,341
Current portion of
long-term loans ..... 39,985 4.54% 25,822 376,684
Long-term loans ...... 16,907 3.16% 36,594 159,275
................................ ¥151,614 ¥184,629 $1,428,300
The annual maturities of long-term loans as of March 31, 2000 are
as follows:
Thousands of
Years ending March 31 Millions of yen U.S. dollars
2002........................................................ ¥10,195 $96,043
2003........................................................ 3,782 35,629
2004........................................................ 2,286 21,536
2005........................................................ 526 4,955
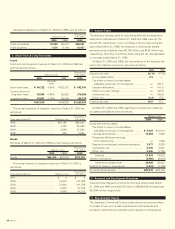
Bonds
Bonds as of March 31, 2000 and 1999 are summarized as follows:
Thousands of
Millions of yen U.S. dollars
2000 1999 2000
Bonds ......................................... ¥60,750 ¥57,570 $572,303
The annual maturity of long-term loans as of March 31, 2000 is
as follows:
Thousands of
Years ending March 31 Millions of yen U.S. dollars
2001........................................................ ¥ 0 $ 0
2002........................................................ 15,000 141,309
2003........................................................ 15,000 141,309
2004........................................................ 5,000 47,103
2005........................................................ 5,000 47,103
7. Income Taxes
The statutory tax rates used for calculating deferred tax assets and
deferred tax liabilities as of March 31, 2000 and 1999 were 42.1%
and 47.7%, respectively. Due to a change in the tax rate during the
year ended March 31, 1999, the balances of deferred tax assets
and deferred tax liabilities were ¥3,793 million and ¥239 million less,
respectively, than they would have been using the tax rate applicable
for the year ended March 31, 1998.
At March 31, 2000 and 1999, the reconciliation of the statutory tax
rate to the effective income tax rate was as follows:
2000 1999
Statutory tax rate....................................................... 42.1% 47.7%
Accumulated deficit .............................................. 9.9 1—
Tax effect on loss of a consolidated
subsidiary previously not recognized .................. —122.7
Valuation allowance............................................... —(16.1)
Effect of tax-rate change....................................... —(40.8)
Inventories, etc. ................................................... —(35.5)
Other, net.............................................................. (2.2) (7.8)
Effective tax rate ....................................................... 39.9 70.2
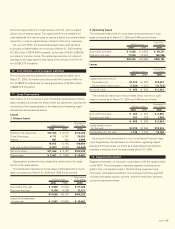
At March 31, 2000 and 1999, significant components of deferred
tax assets and liabilities were as follows:
Millions of yen
2000 1999
Gross deferred tax assets:
Tax effect on loss of a consolidated
subsidiary previously not recognized.............. ¥ 2,528 ¥12,814
Tax loss carryforward ....................................... 10,894 7,668
Temporary difference carrying
from restructuring .......................................... —1,886
Reserve for employees’ retirement allowance
.... 3,977 3,036
Inventories, etc. ............................................... 5,015 3,827
Other, net......................................................... 9,465 5,704
Subtotal ........................................................ 31,879 34,935
Valuation allowance.............................................. (4,980) (6,413)
Deferred tax assets total.............................. 26,899 28,522
Deferral of taxes on fixed assets.......................... (1,619) (1,798)
Net deferred tax assets........................................ ¥25,279 ¥26,724
8. Research and Development Expenses
Total amounts charged to income for the fiscal years ended March
31, 2000 and 1999 were ¥25,376 million (US$239,058 thousand) and
¥27,944 million, respectively.
9. Shareholders’ Equity
The Japanese Commercial Code provides that an amount equivalent
to at least 10 per cent of cash distributions (cash dividends and
bonuses to directors and corporate auditors) paid in a fiscal period