Konica Minolta 2000 Annual Report Download - page 19
Download and view the complete annual report
Please find page 19 of the 2000 Konica Minolta annual report below. You can navigate through the pages in the report by either clicking on the pages listed below, or by using the keyword search tool below to find specific information within the annual report.-
 1
1 -
2
-
3
-
4
-
5
-
6
-
7
-
8
-
 9
9 -
 10
10 -
 11
11 -
 12
12 -
 13
13 -
 14
14 -
 15
15 -
 16
16 -
 17
17 -
 18
18 -
 19
19 -
 20
20 -
 21
21 -
 22
22 -
 23
23 -
 24
24 -
 25
25 -
 26
26 -
 27
27 -
 28
28 -
 29
29 -
30
-
31
-
32
-
33
-
34
-
35
-
36
 |
 |
KONICA 17
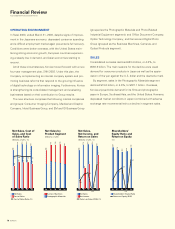
ROA
(%)
’96 ’97 ’98 ’99 ’00
0.39
0.79
0.90
–0.52
1.34
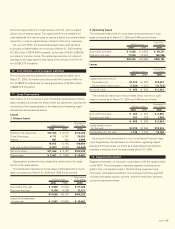
Current Ratio
(Times)
’96 ’97 ’98 ’99 ’00
1.2
1.3
1.2 1.21.2
’96 ’97 ’98 ’99 ’00
D/E Ratio
(Billions of yen, times)
Interest-Bearing Debt
Shareholders’ Equity
D/E Ratio (times)
191
213
234
248
212
164
165
167
158
163
1.1
1.2
1.4 1.5 1.3
Interest
Coverage
(Times)
’96 ’97 ’98 ’99 ’00
1.8
2.5
2.9
3.3
1.2
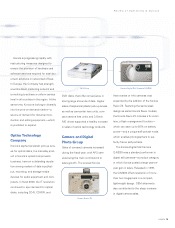
Sales in the Business Machines segment fell ¥7.9 billion, or
3.2%, to ¥239.8 billion, primarily as a result of the cancellation
of an OEM contract to supply printers. Konica boosted sales
of business machines in the United States and maintained its
leading share of the market for high-speed digital copiers.
By geographic region, sales in Japan increased ¥4.1 billion,
or 1.2%, to ¥332.6 billion. Overseas, sales in North America
fell ¥21.2 billion, or 14.1%, to ¥129.2 billion; sales in Europe fell
¥7.9 billion, or 9.2%, to ¥78.1 billion; and sales in Asia increased
¥1.6 billion, or 8.4%, to ¥21.0 billion.
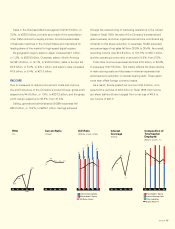
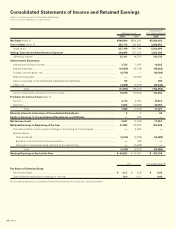
INCOME
Due to measures to reduce procurement costs and improve
the profit structure of the Company’s product lineup, gross profit
slipped only ¥4.6 billion, or 1.9%, to ¥237.2 billion, and the gross
profit margin edged up to 42.3%, from 41.4%.
Selling, general and administrative (SG&A) expenses fell
¥23.2 billion, or 10.2%, to ¥204.1 billion. Savings achieved
through the restructuring of marketing operations in the United
States in fiscal 1999, the sale of the Company’s presensitized
plate business, and other organizational reforms contributed sig-
nificantly to this steep reduction in expenses. SG&A expenses
as a percentage of net sales fell from 38.9% to 36.4%. As a result,
operating income rose ¥18.6 billion, or 127.3%, to ¥33.1 billion,
and the operating income ratio improved to 5.9%, from 2.5%.
Total other income (expenses) declined ¥7.5 billion, or 29.6%,
to expenses of ¥17.9 billion. This mainly reflects the sharp decline
in restructuring costs and decrease in interest expenses that
accompanied a reduction in interest-bearing debt. These gains
more than offset foreign currency losses.
As a result, Konica posted net income of ¥7.6 billion, com-
pared with a net loss of ¥3.2 billion in fiscal 1999. Net income
per share (before dilution) surged from a net loss of ¥8.9 to
net income of ¥21.3.
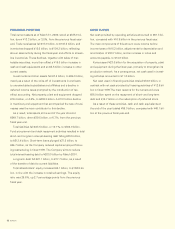
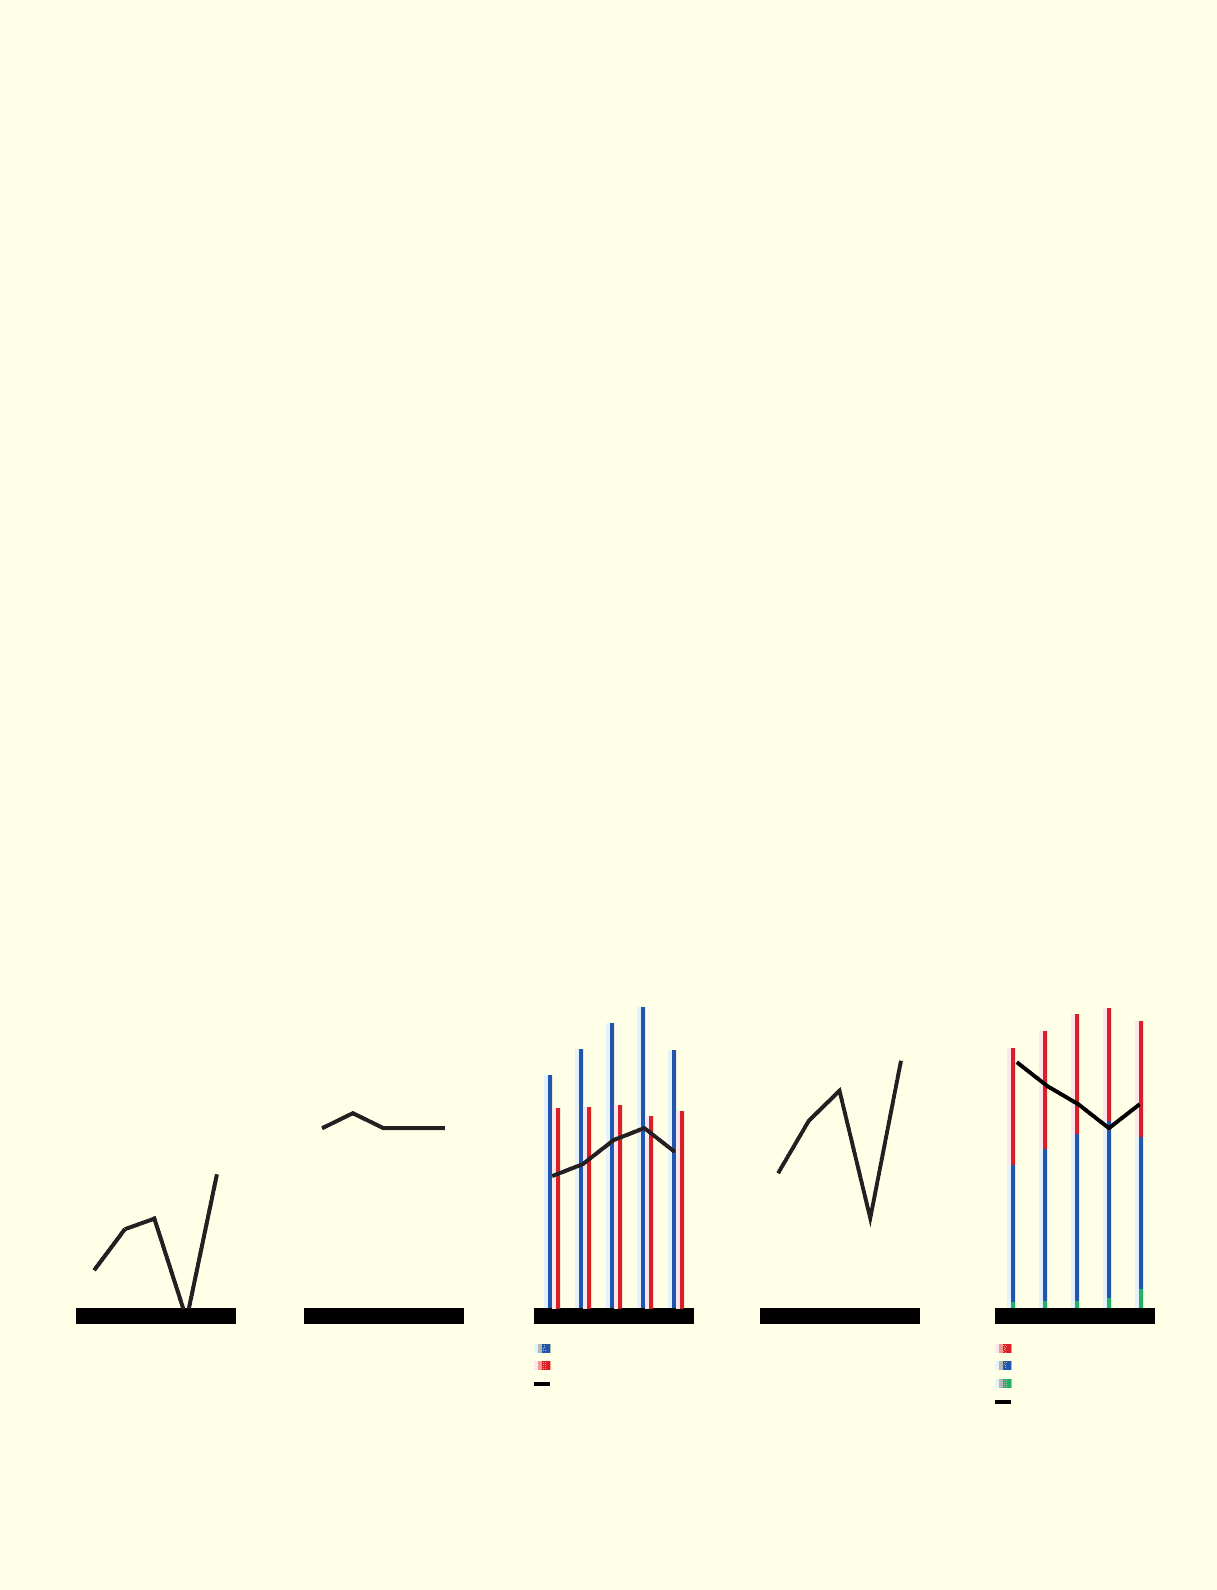
Composition of
Total Capital
Employed
(Billions of yen, %)
Shareholders’ Equity
Interest-Bearing Debt
Other Liabilities
Equity Ratio (%)
’96 ’97 ’98 ’99 ’00
82
74
68
60
68