Konica Minolta 2000 Annual Report Download - page 25
Download and view the complete annual report
Please find page 25 of the 2000 Konica Minolta annual report below. You can navigate through the pages in the report by either clicking on the pages listed below, or by using the keyword search tool below to find specific information within the annual report.-
 1
1 -
2
-
3
-
4
-
5
-
6
-
7
-
8
-
9
-
10
-
11
-
12
-
13
-
14
-
 15
15 -
 16
16 -
 17
17 -
 18
18 -
 19
19 -
 20
20 -
 21
21 -
 22
22 -
 23
23 -
 24
24 -
 25
25 -
 26
26 -
 27
27 -
 28
28 -
 29
29 -
 30
30 -
 31
31 -
 32
32 -
 33
33 -
 34
34 -
 35
35 -
36
 |
 |

KONICA 23
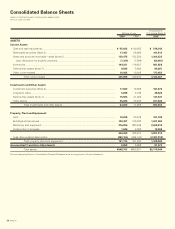
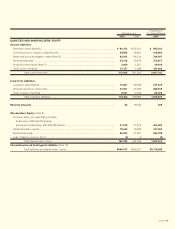
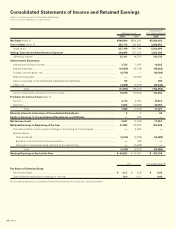
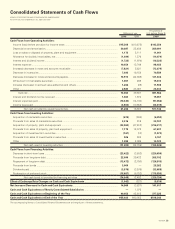
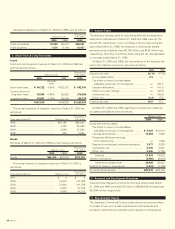
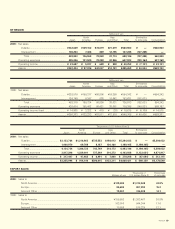
Consolidated Statements of Cash Flows
KONICA CORPORATION AND CONSOLIDATED SUBSIDIARIES
For the fiscal years ended March 31, 2000 and 1999
Thousands of
Millions of yen U.S. dollars (Note 2)
2000 1999 2000
Cash Flows from Operating Activities:
Income (loss) before provision for income taxes ............................................................................. ¥15,206 ¥(10,872) $143,250
Depreciation and amortization.......................................................................................................... 30,687 32,488 289,091
Loss on sales or disposal of property, plant and equipment ............................................................ 1,172 2,111 11,041
Allowance for doubtful receivables, net ........................................................................................... (1,494) 1,376 (14,074)
Interest and dividend income ........................................................................................................... (1,722) (1,974) (16,222)
Interest expense .............................................................................................................................. 10,454 13,749 98,483
(Increase) decrease in notes and accounts receivable ..................................................................... (7,821) 5,621 (73,679)
Decrease in inventories.................................................................................................................... 7,493 16,158 70,589
Decrease (increase) in notes and accounts payable......................................................................... 13,973 (42,368) 131,634
Write-down of marketable securities ............................................................................................... 1,657 269 15,610
Increase (decrease) in accrued value-added tax and others............................................................. 1,264 (38) 11,908
Other ................................................................................................................................................ 2,583 23,067 24,333
Subtotal .................................................................................................................................... 73,452 39,587 691,964
Interest and dividend income received ............................................................................................ 1,662 1,974 15,657
Interest expenses paid ..................................................................................................................... (10,345) (14,100) (97,456)
Income taxes paid ............................................................................................................................ (3,505) (10,558) (33,019)
Net cash provided by operating activities......................................................................... 61,264 16,903 577,146
Cash Flows from Investing Activities:
Acquisition of marketable securities ................................................................................................ (674) (394) (6,350)
Proceeds from sales of marketable securities ................................................................................. 3,416 819 32,181
Acquisition of property, plant and equipment .................................................................................. (22,962) (47,612) (216,317)
Proceeds from sales of property, plant and equipment ................................................................... 7,179 12,073 67,631
Acquisition of investments in securities........................................................................................... (167) (10) (1,573)
Proceeds from sales of investments in securities ........................................................................... 506 324 4,767
Other ................................................................................................................................................ 1,499 2,095 14,122
Net cash used in investing activities ................................................................................ (11,203) (32,705) (105,539)
Cash Flows from Financing Activities:
Decrease in short-term loans ........................................................................................................... (23,422) (3,802) (220,650)
Proceeds from long-term debt ......................................................................................................... 22,090 29,432 208,102
Repayment of long-term debt .......................................................................................................... (13,472) (2,780) (126,915)
Proceeds from bonds ....................................................................................................................... 3,000 —28,262
Dividends paid .................................................................................................................................. (3,576) (3,576) (33,688)
Redemption of preferred stock ........................................................................................................ (18,667) (6,782) (175,855)
Net cash (used in) provided by financing activities........................................................... (34,048) 12,492 (320,754)
Effect of Exchange Rate Changes on Cash and Cash Equivalents ................................................ (1,042) (527) (9,816)
Net Increase (Decrease) in Cash and Cash Equivalents.................................................................. 14,969 (3,837) 141,017
Cash and Cash Equivalents of Newly Consolidated Subsidiaries ................................................. —1,075 —
Cash and Cash Equivalents at Beginning of the Year..................................................................... 40,053 42,815 377,325
Cash and Cash Equivalents at End of the Year ............................................................................... ¥55,022 ¥40,053 $518,342
The accompanying Notes to Consolidated Financial Statements are an integral part of these statements.