Konica Minolta 2000 Annual Report Download - page 18
Download and view the complete annual report
Please find page 18 of the 2000 Konica Minolta annual report below. You can navigate through the pages in the report by either clicking on the pages listed below, or by using the keyword search tool below to find specific information within the annual report.-
 1
1 -
2
-
3
-
4
-
5
-
6
-
7
-
 8
8 -
 9
9 -
 10
10 -
 11
11 -
 12
12 -
 13
13 -
 14
14 -
 15
15 -
 16
16 -
 17
17 -
 18
18 -
 19
19 -
 20
20 -
 21
21 -
 22
22 -
 23
23 -
 24
24 -
 25
25 -
 26
26 -
 27
27 -
 28
28 -
29
-
30
-
31
-
32
-
33
-
34
-
35
-
36
 |
 |
OPERATING ENVIRONMENT
In fiscal 2000, ended March 31, 2000, despite signs of improve-
ment in the Japanese economy, depressed consumer spending
and a difficult employment market again prevented a full recovery.
Conditions were better overseas, with the United States main-
taining strong economic growth, European countries experienc-
ing a steady rise in demand, and Asian economies starting to
recover.
Amid these circumstances, Konica moved forward with a new
four-year management plan, SAN 2003. Under this plan, the
Company is implementing an internal company system and pro-
moting business reforms that respond to the growing influence
of digital technology on information imaging. Furthermore, Konica
is strengthening its consolidated management and evaluating
businesses based on their contribution to Group results.
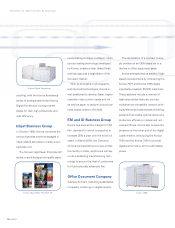
The new structure comprises the following internal companies
and groups: Consumer Imaging Company, Medical and Graphic
Company, Inkjet Business Group, and EM and ID Business Group
(grouped as the Photographic Materials and Photo-Related
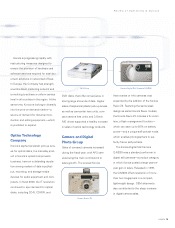
Industrial Equipment segment); and Office Document Company,
Optics Technology Company, and Camera and Digital Photo
Group (grouped as the Business Machines, Cameras, and
Optical Products segment).
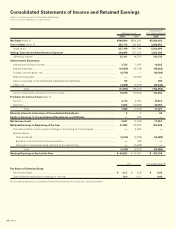
SALES
Consolidated net sales declined ¥23.4 billion, or 4.0%, to
¥560.9 billion. The main reasons for the decline were weak
demand for consumer products in Japan as well as the appre-
ciation of the yen against the U.S. dollar and the deutsche mark.
By segment, sales in the Photographic Materials segment
declined ¥15.6 billion, or 4.6%, to ¥321.1 billion. Overseas,
Konica enjoyed brisk demand for its films and photographic
paper in Europe, Southeast Asia, and the United States. However,
depressed market conditions in Japan (combined with adverse
exchange rate movements) led to a decline in segment sales.
16 KONICA
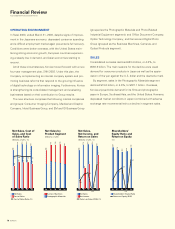
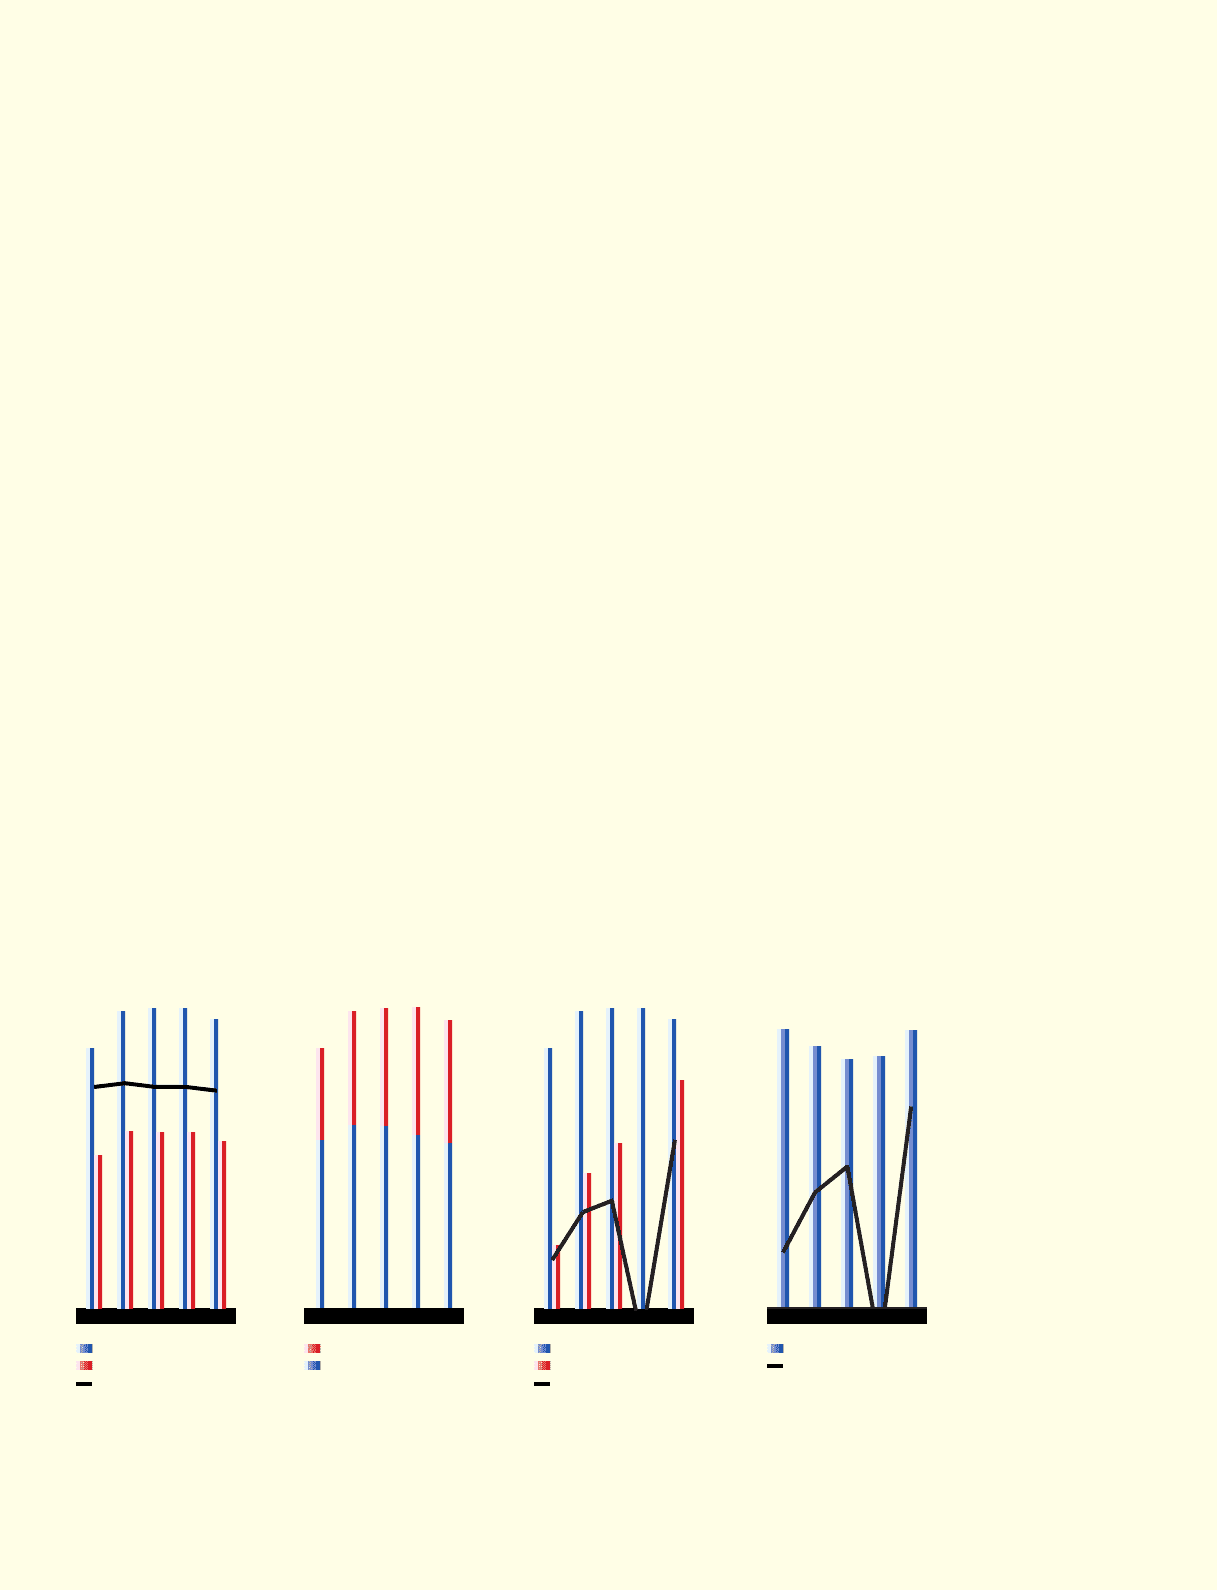
Net Sales, Cost of
Sales, and Cost
of Sales Ratio
(Billions of yen, %)
Net Sales
Cost of Sales
Cost of Sales Ratio (%)
505
578
584
584
561
298
345
342
343
324
’96 ’97 ’98 ’99 ’00
59 60 59 59 58
505
578
584
584
561
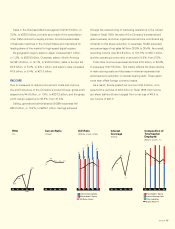
Net Sales by
Product Segment
(Billions of yen)
Business Machines
Photographic Materials
’96 ’97 ’98 ’99 ’00
’96 ’97 ’98 ’00
Net Sales,
Net Income, and
Return on Sales
(Billions of yen, %)
Net Sales
Net Income
Return on Sales (ROS) (%)
505
578
584
584
561
2.1
4.5
5.5
7.6
’99
0.4
–3.2
0.8
0.9
–0.5
1.4
29.8
27.9
26.6
26.9
29.6
’96 ’97 ’98 ’99 ’00
Shareholders’
Equity Ratio and
Return on Equity
(%)
Shareholders’ Equity Ratio
Return on Equity (ROE)
2.7
3.3
–1.9
4.7
1.3
Financial Review
(Consolidated Financial Statements)