Kia 2002 Annual Report Download - page 25
Download and view the complete annual report
Please find page 25 of the 2002 Kia annual report below. You can navigate through the pages in the report by either clicking on the pages listed below, or by using the keyword search tool below to find specific information within the annual report.-
 1
1 -
2
-
3
-
4
-
5
-
6
-
7
-
8
-
9
-
10
-
11
-
12
-
13
-
14
-
 15
15 -
 16
16 -
 17
17 -
 18
18 -
 19
19 -
 20
20 -
 21
21 -
 22
22 -
 23
23 -
 24
24 -
 25
25 -
 26
26 -
 27
27 -
 28
28 -
 29
29 -
 30
30 -
 31
31 -
 32
32 -
 33
33 -
 34
34 -
 35
35 -
36
-
37
-
38
-
39
 |
 |

2002 KIA MO TO RS AN N UAL REPORT
4647
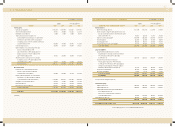
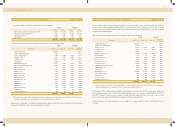
Financial Statements & Notes
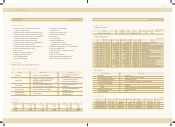
Cash flow s from operating activities:
Net income 641,379 552,235 534,304 460,042
Adjustments to reconcile net income to net cash provided
by operating activities:
Depreciation and amortization 462,596 452,117 385,368 376,639
Provision for doubtful accounts - 168,676 - 140,516
Provision for severance benefits 222,579 180,715 185,421 150,546
Provision for w arranties 374,783 462,202 312,215 385,040
Reversal of allow ance for doubtful accounts (5,921) - (4,933) -
Loss (gain) on foreign currency translation, net (47,661) 3,702 (39,704) 3,084
Loss on valuation of inventories 2,520 10,432 2,099 8,690
Gain on valuation of investments accounted
for using the equity method, net (43,776) (11,996) (36,468) (9,993)
Gain on disposal of marketable securities, net - (20,143) - (16,780)
Gain on disposal of investment, net (1,767) (6,375) (1,472) (5,311)
Loss on impairment of investments 2,550 - 2,124 -
Loss on disposal of property, plant and equipment, net 42,874 6,848 35,716 5,705
Amortization of present value discount, net 864 (8,712) 720 (7,258)
Other extraordinary income - (197,301) - (164,363)
Compensation expenses on stock options (368) 2,291 (307) 1,909
Changes in operating assets and liabilities:
Decrease (Increase) in trade notes and accounts
receivable 258,428 (10,053) 215,285 (8,375)
Decrease (Increase) in long-term notes and accounts
receivable (1,164) 6,084 (970) 5,068
Decrease (Increase) in inventories (67,121) 215,397 (55,916) 179,438
Decrease in advances and other receivables 114,600 51,234 95,468 42,681
Decrease in other current assets 66,722 53,891 55,583 44,894
Decrease in deferred income tax assets 54,561 69,218 45,452 57,662
Increase (Decrease) in trade notes and accounts payable 282,928 (441,026) 235,695 (367,399)
Increase in accounts payable-other 50,216 26,958 41,833 22,458
Decrease in other current liabilities (26,730) (35,152) (22,268) (29,284)
Decrease in derivative instruments credit - (39,207) - (32,662)
Increase in income tax payable 70,099 - 58,396 -
Payment of w arranties (296,366) (276,707) (246,889) (230,512)
Payment of severance benefits (55,409) (68,529) (46,159) (57,088)
Other 4,254 15,366 3,547 12,801
2,105,670 1,162,165 1,754,140 968,148
(continued)
NON-CONSOLIDATED STATEM ENTS OF CASH FLOWS
2002 2001 2002 2001
Korean won Translation into U.S. dollars(Note 2)
(in millions) (in thousands)
Korean won Translation into U.S. dollars(Note 2)
(in millions) (in thousands)
FOR THE YEARS ENDED DECEM BER 31, 2002 AND 2001
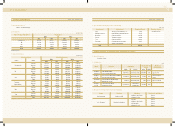
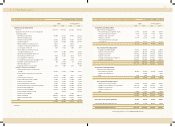
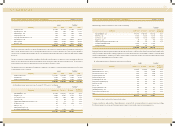
Cash flow s from investing activities:
Cash inflow s from investing activities:
Proceeds from disposal of marketable securities 21,105 228,858 17,582 190,651
Proceeds from disposal of investments 12,018 28,865 10,012 24,046
Reduction in other current assets 136 3,047 113 2,538
Reduction in other assets 46,777 87,635 38,968 73,005
Proceeds from disposal of property, plant
and equipment 56,440 325,553 47,018 271,204
136,476 673,958 113,693 561,444
Cash outflow s from investing activities:
Acquisition of marketable securities (10,051) (34,816) (8,373) (29,004)
Additions to other current assets (367,661) (346,124) (306,282) (288,341)
Acquisition of investments (160,392) (280,310) (133,615) (233,514)
Additions to other assets (151,979) (191,820) (126,607) (159,797)
Acquisition of property, plant and equipment (383,728) (543,720) (319,667) (452,948)
Acquisition of intangible assets (164,441) (112,332) (136,988) (93,579)
(1,238,252) (1,509,122) (1,031,533) (1,257,183)
(1,101,776) (835,164) (917,840) (695,739)
Cash flow s from financing activities:
Cash inflow s from financing activities:
Proceeds from long-term debt 262,489 610,602 218,668 508,665
Refund of asset revaluation tax - 22,044 - 18,364
Other 5,776 6,856 4,812 5,711
268,265 639,502 223,480 532,740
Cash outflow s from financing activities:
Repayment of short-term borrow ings (11,809) (20,286) (9,838) (16,899)
Repayment of current maturities of long-term debt (367,679) (692) (306,297) (576)
Repayment of long-term debt (377,125) (380,531) (314,166) (317,003)
Acquisition of treasury stock - (343,331) - (286,014)
Other (2,656) (2,447) (2,213) (2,038)
(759,269) (747,287) (632,514) (622,530)
(491,004) (107,785) (409,034) (89,790)
Net increase in cash and cash equivalents 512,890 219,216 427,266 182,619
Cash and cash equivalents, beginning of year 250,849 31,633 208,971 26,352
Cash and cash equivalents, end of year 763,739 250,849 636,237 208,971
See accompanying notes to non-consolidated financial statements.
NON-CONSOLIDATED STATEM ENTS OF CASH FLOWS (CONTINUED)
2002 2001 2002 2001
FOR THE YEARS ENDED DECEM BER 31, 2002 AND 2001