Kia 2002 Annual Report Download - page 24
Download and view the complete annual report
Please find page 24 of the 2002 Kia annual report below. You can navigate through the pages in the report by either clicking on the pages listed below, or by using the keyword search tool below to find specific information within the annual report.-
 1
1 -
2
-
3
-
4
-
5
-
6
-
7
-
8
-
9
-
10
-
11
-
12
-
13
-
 14
14 -
 15
15 -
 16
16 -
 17
17 -
 18
18 -
 19
19 -
 20
20 -
 21
21 -
 22
22 -
 23
23 -
 24
24 -
 25
25 -
 26
26 -
 27
27 -
 28
28 -
 29
29 -
 30
30 -
 31
31 -
 32
32 -
 33
33 -
 34
34 -
35
-
36
-
37
-
38
-
39
 |
 |

2002 KIA MO TO RS AN N UAL REPORT
4445
Financial Statements & Notes
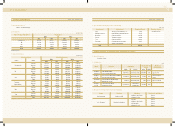
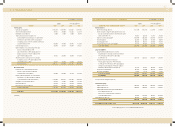
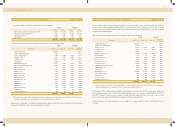
NON-CONSOLIDATED STATEM ENTS OF INCOM E
2002 2001 2002 2001
Korean won Translation into U. S. dollars (Note 2)
(in millions, except per share amounts) (in thousands, except per share amounts)
Korean won Translation into U.S. dollars (Note 2)
(in millions) (in thousands)
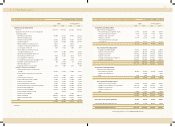
FOR THE YEARS ENDED DECEM BER 31, 2002 AND 2001
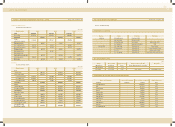
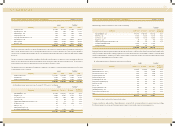
Unappropriated retained earnings (accumulated deficit
before disposition):
Beginning of year (324,952) (783,887) (270,703) (653,021)
Beginning balance adjustments:
Cumulative effects of accounting changes - (39,555) - (32,952)
Asset revaluation tax (Note 16) - (12,212) - (10,173)
Adjustments in investment securities using the
equity method and others - (41,533) - (34,599)
Net income 641,379 552,235 534,304 460,042
316,427 (324,952) 263,601 (270,703)
Appropriations (Disposition)
Legal reserve 9,300 - 7,748 -
Reserve for technology development 214,500 - 178,690 -
Cash dividends declared (Note 18) 92,030 - 76,666
315,830 - 263,104
Unappropriated retained earnings (Undisposed accumulated deficit), end of year
597 (324,952) 497 (270,703)
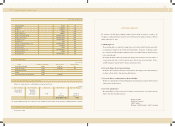
See accompanying notes to non-consolidated financial statements.
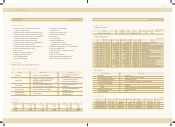
NON-CONSOLIDATED STATEM ENTS OF APPROPRIATIONS OF RETAINED EARNINGS
2002 2001 2002 2001
FOR THE YEARS ENDED DECEM BER 31, 2002 AND 2001
Sales (Note 23) 14,056,450 12,356,346 11,709,805 10,293,524
Cost of sales 11,479,729 9,758,758 9,563,253 8,129,588
Gross profit 2,576,721 2,597,588 2,146,552 2,163,936
Selling and administrative expenses (Note 22) 1,918,228 2,075,347 1,597,991 1,728,879
Operating income 658,493 522,241 548,561 435,057
Other income (expenses), net:
Interest expense, net (13,865) (75,455) (11,551) (62,858)
Foreign exchange gain (loss), net 150,480 (28,179) 125,358 (23,475)
Reversal of allow ance for doubtful accounts 5,921 - 4,933 -
Loss on valuation of inventories (2,520) (10,432) (2,099) (8,690)
Gain on valuation of investments securities
accounted for using the equity method (Note 4) 43,776 11,996 36,468 9,993
Loss on disposal of accounts receivable (40,420) (93,249) (33,672) (77,682)
Gain on disposal of marketable securities, net - 20,143 - 16,780
Gain on disposal of investments 1,767 6,375 1,472 5,311
Loss on impairment of investments (Note 4) (2,550) - (2,124) -
Loss on disposal of property, plant and equipment (42,874) (6,848) (35,716) (5,705)
Other, net 43,102 77,559 35,905 64,610
142,817 (98,090) 118,974 (81,716)
Ordinary income 801,310 424,151 667,535 353,341
Extraordinary item:
Other extraordinary income (Note 16) - 197,301 - 164,363
Income before income tax 801,310 621,452 667,535 517,704
Income tax expense (Note 17) 159,931 69,217 133,231 57,662
Net income 641,379 552,235 534,304 460,042
Ordinary income per common share (Note 2) 1,743 916 1.45 0.76
Earnings per common share (Note 2) 1,743 1,424 1.45 1.19
See accompanying notes to non-consolidated financial statements.