JCPenney 2009 Annual Report Download - page 24
Download and view the complete annual report
Please find page 24 of the 2009 JCPenney annual report below. You can navigate through the pages in the report by either clicking on the pages listed below, or by using the keyword search tool below to find specific information within the annual report.-
 1
1 -
2
-
3
-
4
-
5
-
6
-
7
-
8
-
9
-
10
-
11
-
12
-
13
-
 14
14 -
 15
15 -
 16
16 -
 17
17 -
 18
18 -
 19
19 -
 20
20 -
 21
21 -
 22
22 -
 23
23 -
 24
24 -
 25
25 -
 26
26 -
 27
27 -
 28
28
 |
 |

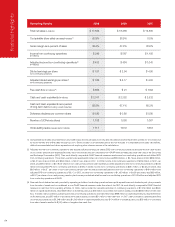
Operating Results 2009 2008 2007
Total net sales (in millions) $ 17,556 $ 18,486 $ 19,860
Comparable store sales (decrease)/increase(1) (6.3)% (8.5)% 0.0%
Gross margin as a percent of sales 39.4% 37.4% 38.6%
Income from continuing operations $ 249 $ 567 $ 1,105
(in millions)
Adjusted income from continuing operations(2) $ 433 $ 484 $ 1,043
(in millions)
Diluted earnings per share $ 1.07 $ 2.54 $ 4.90
from continuing operations
Adjusted diluted earnings per share(2) $ 1.86 $ 2.17 $ 4.63
from continuing operations
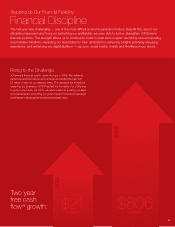
Free cash ow (in millions)
(3) $ 806 $ 21 $ (142)
Cash and cash equivalents (in millions) $ 3,011 $ 2,352 $ 2,532
Cash and cash equivalents as a percent 88.8% 67.1% 68.3%
of long-term debt, including current maturities
Dividends declared per common share $ 0.80 $ 0.80 $ 0.80
Number of JCPenney stores 1,108 1,093 1,067
Gross selling space (square feet in millions) 111.7 109.9 106.6
24
nancial highlights
Comparable store sales are presented on a 52-week basis and include sales from new and relocated stores that have been opened for 12 consecutive
full scal months and online sales through jcp.com. Stores closed for an extended period are not included in comparable store sales calculations,
while stores remodeled and minor expansions not requiring store closures remain in the calculations.
Adjusted income from continuing operations and adjusted diluted earnings per share (EPS) from continuing operations exclude the non-cash impact
of our primary pension plan expense/(income), net of income tax and are considered non-GAAP nancial measures under the rules of the Securities
and Exchange Commission (SEC). Their most directly comparable GAAP nancial measures are income from continuing operations and diluted EPS
from continuing operations. The primary pension plan expense/(income), net of income tax was $184 million, or $0.79 per share in 2009; $(83) million,
or $(0.37) per share in 2008; and $(62) million, or $(0.27) per share in 2007. In 2009, income from continuing operations of $249 million, or $1.07 per
share, plus $184 million, or $0.79 per share of non-cash primary pension plan expense provided adjusted income from continuing operations of $433
million and adjusted EPS from continuing operations of $1.86. In 2008, income from continuing operations of $567 million, or $2.54 per share, less
$83 million, or $0.37 per share of non-cash primary pension plan income provided adjusted income from continuing operations of $484 million and
adjusted EPS from continuing operations of $2.17. In 2007, income from continuing operations of $1,105 million, or $4.90 per share, less $62 million,
or $0.27 per share of non-cash primary pension plan income provided adjusted income from continuing operations of $1,043 million and adjusted EPS
from continuing operations of $4.63.
Free cash ow is dened as cash provided by operating activities of continuing operations less capital expenditures and dividends paid, plus proceeds
from the sale of assets and is considered a non-GAAP nancial measure under the rules of the SEC; its most directly comparable GAAP nancial
measure is cash ow from operating activities. In 2009, cash provided by operating activities of continuing operations of $1,576 million less $600
million of capital expenditures, less $183 million of dividends paid, plus $13 million of proceeds from sale of assets provided $806 million of free cash
ow. In 2008, cash provided by operating activities of continuing operations of $1,155 million less $969 million of capital expenditures, less $178 million
of dividends paid, plus $13 million of proceeds from sale of assets provided $21 million of free cash ow. In 2007, cash provided by operating activities
of continuing operations of $1,249 million less $1,243 million of capital expenditures, less $174 million of dividends paid, plus $26 million of proceeds
from sale of assets resulted in $(142) million of negative free cash ow.
(1)
(2)
(3)