Intel 2014 Annual Report Download - page 77
Download and view the complete annual report
Please find page 77 of the 2014 Intel annual report below. You can navigate through the pages in the report by either clicking on the pages listed below, or by using the keyword search tool below to find specific information within the annual report.-
 1
1 -
2
-
3
-
4
-
5
-
6
-
7
-
8
-
9
-
10
-
11
-
12
-
13
-
14
-
15
-
16
-
17
-
18
-
19
-
20
-
21
-
22
-
23
-
24
-
25
-
26
-
27
-
28
-
29
-
30
-
31
-
32
-
33
-
34
-
35
-
36
-
37
-
38
-
39
-
40
-
41
-
42
-
43
-
44
-
45
-
46
-
47
-
48
-
49
-
50
-
51
-
52
-
53
-
54
-
55
-
56
-
57
-
58
-
59
-
60
-
61
-
62
-
63
-
64
-
65
-
66
-
 67
67 -
 68
68 -
 69
69 -
 70
70 -
 71
71 -
 72
72 -
 73
73 -
 74
74 -
 75
75 -
 76
76 -
 77
77 -
 78
78 -
 79
79 -
 80
80 -
 81
81 -
 82
82 -
 83
83 -
 84
84 -
 85
85 -
 86
86 -
 87
87 -
88
-
89
-
90
-
91
-
92
-
93
-
94
-
95
-
96
-
97
-
98
-
99
-
100
-
101
-
102
-
103
-
104
-
105
-
106
-
107
-
108
-
109
-
110
-
111
-
112
-
113
-
114
-
115
-
116
-
117
-
118
-
119
-
120
-
121
-
122
-
123
-
124
-
125
-
126
-
127
-
128
-
129
 |
 |

INTEL CORPORATION
NOTES TO CONSOLIDATED FINANCIAL STATEMENTS (Continued)
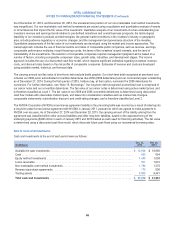
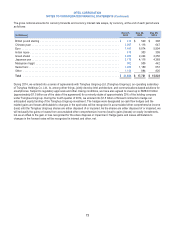
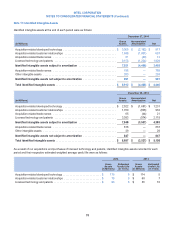
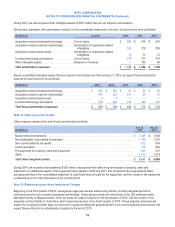
The gross notional amounts for currency forwards and currency interest rate swaps, by currency, at the end of each period were
as follows:
(In Millions)
Dec 27,
2014
Dec 28,
2013
Dec 29,
2012
British pound sterling ....................................................... $ 410 $ 549 $ 308
Chinese yuan ............................................................. 3,097 1,116 647
Euro .................................................................... 7,486 6,874 5,994
Indian rupee .............................................................. 418 303 309
Israeli shekel ............................................................. 2,489 2,244 2,256
Japanese yen ............................................................. 3,779 4,116 4,389
Malaysian ringgit .......................................................... 902 506 442
Swiss franc ............................................................... 1,289 1,189 657
Other ................................................................... 1,154 884 826
Total ................................................................... $ 21,024 $ 17,781 $ 15,828
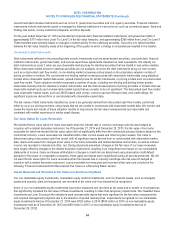
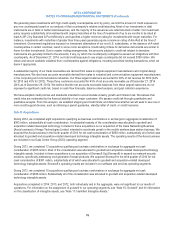
During 2014, we entered into a series of agreements with Tsinghua Unigroup Ltd. (Tsinghua Unigroup), an operating subsidiary
of Tsinghua Holdings Co. Ltd., to, among other things, jointly develop Intel architecture- and communications-based solutions for
smartphones. Subject to regulatory approvals and other closing conditions, we have also agreed to invest up to RMB 9.0 billion
(approximately $1.5 billion as of the date of the agreement) for a minority stake of approximately 20% of the holding company
under Tsinghua Unigroup. During the fourth quarter of 2014, we entered into $1.5 billion of forward contracts to hedge our
anticipated equity funding of the Tsinghua Unigroup investment. The hedges were designated as cash flow hedges and the
related gains and losses attributable to changes in the spot rates will be recognized in accumulated other comprehensive income
(loss) until the Tsinghua Unigroup shares are either disposed of or impaired. As the shares are either disposed of or impaired, we
will reclassify the gains or losses from accumulated other comprehensive income (loss) to gains (losses) on equity investments,
net as an offset to the gain or loss recognized for the share disposal or impairment. Hedge gains and losses attributable to
changes in the forward rates will be recognized in interest and other, net.
72