Intel 2014 Annual Report Download - page 114
Download and view the complete annual report
Please find page 114 of the 2014 Intel annual report below. You can navigate through the pages in the report by either clicking on the pages listed below, or by using the keyword search tool below to find specific information within the annual report.-
 1
1 -
2
-
3
-
4
-
5
-
6
-
7
-
8
-
9
-
10
-
11
-
12
-
13
-
14
-
15
-
16
-
17
-
18
-
19
-
20
-
21
-
22
-
23
-
24
-
25
-
26
-
27
-
28
-
29
-
30
-
31
-
32
-
33
-
34
-
35
-
36
-
37
-
38
-
39
-
40
-
41
-
42
-
43
-
44
-
45
-
46
-
47
-
48
-
49
-
50
-
51
-
52
-
53
-
54
-
55
-
56
-
57
-
58
-
59
-
60
-
61
-
62
-
63
-
64
-
65
-
66
-
67
-
68
-
69
-
70
-
71
-
72
-
73
-
74
-
75
-
76
-
77
-
78
-
79
-
80
-
81
-
82
-
83
-
84
-
85
-
86
-
87
-
88
-
89
-
90
-
91
-
92
-
93
-
94
-
95
-
96
-
97
-
98
-
99
-
100
-
101
-
102
-
103
-
 104
104 -
 105
105 -
 106
106 -
 107
107 -
 108
108 -
 109
109 -
 110
110 -
 111
111 -
 112
112 -
 113
113 -
 114
114 -
 115
115 -
 116
116 -
 117
117 -
 118
118 -
 119
119 -
 120
120 -
 121
121 -
 122
122 -
 123
123 -
 124
124 -
125
-
126
-
127
-
128
-
129
 |
 |

INTEL CORPORATION
NOTES TO CONSOLIDATED FINANCIAL STATEMENTS (Continued)
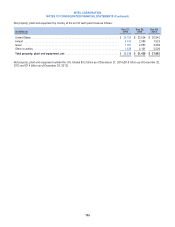
Net property, plant and equipment by country at the end of each period was as follows:
(In Millions)
Dec 27,
2014
Dec 28,
2013
Dec 29,
2012
United States ............................................................. $ 24,020 $ 23,624 $ 20,542
Ireland .................................................................. 5,433 2,986 1,523
Israel ................................................................... 1,957 2,667 3,389
Other countries ........................................................... 1,828 2,151 2,529
Total property, plant and equipment, net ..................................... $ 33,238 $ 31,428 $ 27,983
Net property, plant and equipment outside the U.S. totaled $9.2 billion as of December 27, 2014 ($7.8 billion as of December 28,
2013 and $7.4 billion as of December 29, 2012).
109