Intel 2014 Annual Report Download - page 64
Download and view the complete annual report
Please find page 64 of the 2014 Intel annual report below. You can navigate through the pages in the report by either clicking on the pages listed below, or by using the keyword search tool below to find specific information within the annual report.-
 1
1 -
2
-
3
-
4
-
5
-
6
-
7
-
8
-
9
-
10
-
11
-
12
-
13
-
14
-
15
-
16
-
17
-
18
-
19
-
20
-
21
-
22
-
23
-
24
-
25
-
26
-
27
-
28
-
29
-
30
-
31
-
32
-
33
-
34
-
35
-
36
-
37
-
38
-
39
-
40
-
41
-
42
-
43
-
44
-
45
-
46
-
47
-
48
-
49
-
50
-
51
-
52
-
53
-
 54
54 -
 55
55 -
 56
56 -
 57
57 -
 58
58 -
 59
59 -
 60
60 -
 61
61 -
 62
62 -
 63
63 -
 64
64 -
 65
65 -
 66
66 -
 67
67 -
 68
68 -
 69
69 -
 70
70 -
 71
71 -
 72
72 -
 73
73 -
 74
74 -
75
-
76
-
77
-
78
-
79
-
80
-
81
-
82
-
83
-
84
-
85
-
86
-
87
-
88
-
89
-
90
-
91
-
92
-
93
-
94
-
95
-
96
-
97
-
98
-
99
-
100
-
101
-
102
-
103
-
104
-
105
-
106
-
107
-
108
-
109
-
110
-
111
-
112
-
113
-
114
-
115
-
116
-
117
-
118
-
119
-
120
-
121
-
122
-
123
-
124
-
125
-
126
-
127
-
128
-
129
 |
 |

INTEL CORPORATION
NOTES TO CONSOLIDATED FINANCIAL STATEMENTS (Continued)
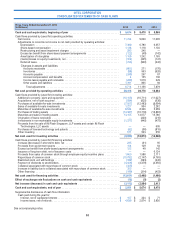
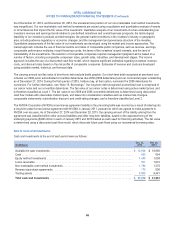
Inventories
We compute inventory cost on a first-in, first-out basis. Costs incurred to manufacture our products are included in the valuation
of inventory beginning in the quarter in which a product meets the technical criteria to qualify for sale to customers. Prior to
qualification for sale, costs that do not meet the criteria for research and development (R&D) are included in cost of sales in the
period incurred. Inventories at the end of each period were as follows:
(In Millions)
Dec 27,
2014
Dec 28,
2013
Raw materials ...................................................................... $ 462 $ 458
Work in process ..................................................................... 2,375 1,998
Finished goods ...................................................................... 1,436 1,716
Total inventories ................................................................... $ 4,273 $ 4,172
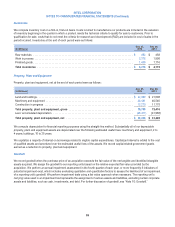
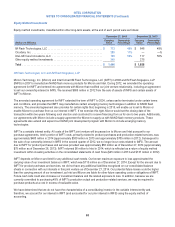
Property, Plant and Equipment
Property, plant and equipment, net at the end of each period were as follows:
(In Millions)
Dec 27,
2014
Dec 28,
2013
Land and buildings ................................................................... $ 22,989 $ 21,098
Machinery and equipment ............................................................. 44,441 40,540
Construction in progress .............................................................. 12,279 11,778
Total property, plant and equipment, gross ............................................. 79,709 73,416
Less: accumulated depreciation ........................................................ (46,471) (41,988)
Total property, plant and equipment, net ............................................... $ 33,238 $ 31,428
We compute depreciation for financial reporting purposes using the straight-line method. Substantially all of our depreciable
property, plant and equipment assets are depreciated over the following estimated useful lives: machinery and equipment, 2 to
4 years; buildings, 10 to 25 years.
We capitalize a majority of interest on borrowings related to eligible capital expenditures. Capitalized interest is added to the cost
of qualified assets and amortized over the estimated useful lives of the assets. We record capital-related government grants
earned as a reduction to property, plant and equipment.
Goodwill
We record goodwill when the purchase price of an acquisition exceeds the fair value of the net tangible and identified intangible
assets acquired. We assign the goodwill to our reporting units based on the relative expected fair value provided by the
acquisition. We perform an annual impairment assessment in the fourth quarter of each year, or more frequently if indicators of
potential impairment exist, which includes evaluating qualitative and quantitative factors to assess the likelihood of an impairment
of a reporting unit’s goodwill. We perform impairment tests using a fair value approach when necessary. The reporting unit’s
carrying value used in an impairment test represents the assignment of various assets and liabilities, excluding certain corporate
assets and liabilities, such as cash, investments, and debt. For further discussion of goodwill, see “Note 10: Goodwill.”
59