Intel 2014 Annual Report Download - page 72
Download and view the complete annual report
Please find page 72 of the 2014 Intel annual report below. You can navigate through the pages in the report by either clicking on the pages listed below, or by using the keyword search tool below to find specific information within the annual report.-
 1
1 -
2
-
3
-
4
-
5
-
6
-
7
-
8
-
9
-
10
-
11
-
12
-
13
-
14
-
15
-
16
-
17
-
18
-
19
-
20
-
21
-
22
-
23
-
24
-
25
-
26
-
27
-
28
-
29
-
30
-
31
-
32
-
33
-
34
-
35
-
36
-
37
-
38
-
39
-
40
-
41
-
42
-
43
-
44
-
45
-
46
-
47
-
48
-
49
-
50
-
51
-
52
-
53
-
54
-
55
-
56
-
57
-
58
-
59
-
60
-
61
-
 62
62 -
 63
63 -
 64
64 -
 65
65 -
 66
66 -
 67
67 -
 68
68 -
 69
69 -
 70
70 -
 71
71 -
 72
72 -
 73
73 -
 74
74 -
 75
75 -
 76
76 -
 77
77 -
 78
78 -
 79
79 -
 80
80 -
 81
81 -
 82
82 -
83
-
84
-
85
-
86
-
87
-
88
-
89
-
90
-
91
-
92
-
93
-
94
-
95
-
96
-
97
-
98
-
99
-
100
-
101
-
102
-
103
-
104
-
105
-
106
-
107
-
108
-
109
-
110
-
111
-
112
-
113
-
114
-
115
-
116
-
117
-
118
-
119
-
120
-
121
-
122
-
123
-
124
-
125
-
126
-
127
-
128
-
129
 |
 |

INTEL CORPORATION
NOTES TO CONSOLIDATED FINANCIAL STATEMENTS (Continued)
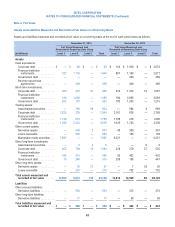
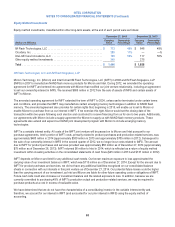
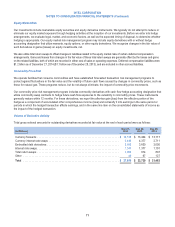
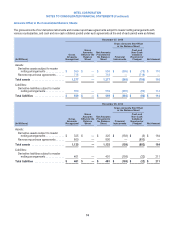
Available-for-Sale Investments
Available-for-sale investments at the end of each period were as follows:
December 27, 2014 December 28, 2013
(In Millions)
Adjusted
Cost
Gross
Unrealized
Gains
Gross
Unrealized
Losses
Fair
Value
Adjusted
Cost
Gross
Unrealized
Gains
Gross
Unrealized
Losses
Fair
Value
Asset-backed securities . . . $8$—$(2)$6$ 11 $ — $ (2) $ 9
Corporate debt .......... 2,040 13 (5) 2,048 4,254 15 (3) 4,266
Financial institution
instruments .......... 3,146 2 (1) 3,147 5,654 5 (1) 5,658
Government debt ........ 741 — (1) 740 1,932 1 (1) 1,932
Marketable equity
securities ............ 3,318 3,779 — 7,097 3,340 2,881 — 6,221
Total available-for-sale
investments ......... $ 9,253 $ 3,794 $ (9) $ 13,038 $ 15,191 $ 2,902 $ (7) $ 18,086
Government debt includes instruments such as non-U.S. government securities and U.S. agency securities. Financial institution
instruments include instruments issued or managed by financial institutions in various forms, such as commercial paper, fixed and
floating rate bonds, money market fund deposits, and time deposits. Time deposits were primarily issued by institutions outside
the U.S. as of December 27, 2014 and December 28, 2013.
During 2014, we sold available-for-sale investments for proceeds of $1.7 billion, of which $509 million related to sales of cash and
cash equivalents ($1.3 billion in 2013, of which $339 million related to sales of cash and cash equivalents; and $3.4 billion in
2012, of which $1.1 billion related to sales of cash and cash equivalents). The gross realized gains on sales of available-for-sale
investments were $136 million in 2014 ($146 million in 2013 and $166 million in 2012). We determine the cost of an investment
sold on an average cost basis at the individual security level. Impairments recognized on available-for-sale investments were
$5 million in 2014 ($14 million in 2013 and $36 million in 2012).
During 2012, we purchased ASML Holding N.V. (ASML) equity securities totaling $3.2 billion. This equity interest has been
accounted for as an available-for-sale investment and is included as marketable equity securities in the preceding table.
For information on the unrealized holding gains (losses) on available-for-sale investments reclassified out of accumulated other
comprehensive income (loss) into the consolidated statements of income, see “Note 24: Other Comprehensive Income (Loss).”
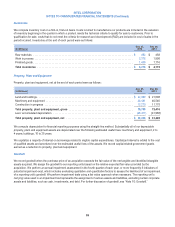
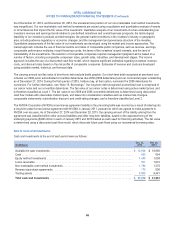
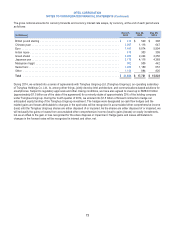
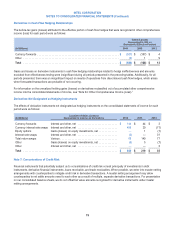
The amortized cost and fair value of available-for-sale debt investments, by contractual maturity, as of December 27, 2014 were
as follows:
(In Millions) Cost Fair Value
Due in 1 year or less ................................................................. $ 3,490 $ 3,500
Due in 1–2 years .................................................................... 1,003 1,004
Due in 2–5 years .................................................................... 964 962
Instruments not due at a single maturity date .............................................. 478 475
Total ............................................................................. $ 5,935 $ 5,941
67