Home Depot 2014 Annual Report Download - page 46
Download and view the complete annual report
Please find page 46 of the 2014 Home Depot annual report below. You can navigate through the pages in the report by either clicking on the pages listed below, or by using the keyword search tool below to find specific information within the annual report.-
 1
1 -
2
-
3
-
4
-
5
-
6
-
7
-
8
-
9
-
10
-
11
-
12
-
13
-
14
-
15
-
16
-
17
-
18
-
19
-
20
-
21
-
22
-
23
-
24
-
25
-
26
-
27
-
28
-
29
-
30
-
31
-
32
-
33
-
34
-
35
-
 36
36 -
 37
37 -
 38
38 -
 39
39 -
 40
40 -
 41
41 -
 42
42 -
 43
43 -
 44
44 -
 45
45 -
 46
46 -
 47
47 -
 48
48 -
 49
49 -
 50
50 -
 51
51 -
 52
52 -
 53
53 -
 54
54 -
 55
55 -
 56
56 -
57
-
58
-
59
-
60
-
61
-
62
-
63
-
64
-
65
-
66
-
67
-
68
-
69
-
70
-
71
 |
 |

41
Comprehensive Income
Comprehensive Income includes Net Earnings adjusted for certain gains and losses that are excluded from Net Earnings
under U.S. generally accepted accounting principles. Adjustments to Net Earnings and Accumulated Other Comprehensive
Income consist primarily of foreign currency translation adjustments.
Foreign Currency Translation
Assets and liabilities denominated in a foreign currency are translated into U.S. dollars at the current rate of exchange on the
last day of the reporting period. Revenues and expenses are generally translated using average exchange rates for the period
and equity transactions are translated using the actual rate on the day of the transaction.
Segment Information
The Company operates within a single reportable segment primarily within North America. Net Sales for the Company
outside the U.S. were $8.5 billion, $8.5 billion and $8.4 billion for fiscal 2014, 2013 and 2012, respectively. Long-lived
assets outside the U.S. totaled $2.5 billion and $2.9 billion as of February 1, 2015 and February 2, 2014, respectively.
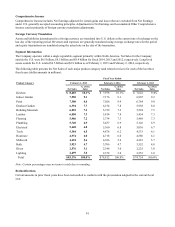
The following table presents the Net Sales of each major product category (and related services) for each of the last three
fiscal years (dollar amounts in millions):
Product Category
Fiscal Year Ended
February 1, 2015 February 2, 2014 February 3, 2013
Net Sales % of Net
Sales Net Sales % of Net
Sales Net Sales % of Net
Sales
Kitchen $ 8,403 10.1% $ 7,978 10.1% $ 7,022 9.4%
Indoor Garden 7,550 9.1 7,176 9.1 6,907 9.2
Paint 7,300 8.8 7,026 8.9 6,764 9.0
Outdoor Garden 6,394 7.7 6,154 7.8 5,958 8.0
Building Materials 6,055 7.3 5,729 7.3 5,594 7.5
Lumber 6,050 7.3 5,814 7.4 5,454 7.3
Flooring 5,986 7.2 5,734 7.3 5,469 7.3
Plumbing 5,740 6.9 5,437 6.9 5,126 6.9
Electrical 5,648 6.8 5,360 6.8 5,036 6.7
Tools 5,384 6.5 4,876 6.2 4,533 6.1
Hardware 4,974 6.0 4,718 6.0 4,580 6.1
Millwork 4,694 5.6 4,386 5.6 4,281 5.7
Bath 3,923 4.7 3,706 4.7 3,552 4.8
Décor 2,576 3.1 2,346 3.0 2,225 3.0
Lighting 2,499 3.0 2,372 3.0 2,253 3.0
Total $83,176 100.0% $78,812 100.0% $74,754 100.0%
Note: Certain percentages may not sum to totals due to rounding.
Reclassifications
Certain amounts in prior fiscal years have been reclassified to conform with the presentation adopted in the current fiscal
year.