Home Depot 2014 Annual Report Download - page 41
Download and view the complete annual report
Please find page 41 of the 2014 Home Depot annual report below. You can navigate through the pages in the report by either clicking on the pages listed below, or by using the keyword search tool below to find specific information within the annual report.-
 1
1 -
2
-
3
-
4
-
5
-
6
-
7
-
8
-
9
-
10
-
11
-
12
-
13
-
14
-
15
-
16
-
17
-
18
-
19
-
20
-
21
-
22
-
23
-
24
-
25
-
26
-
27
-
28
-
29
-
30
-
 31
31 -
 32
32 -
 33
33 -
 34
34 -
 35
35 -
 36
36 -
 37
37 -
 38
38 -
 39
39 -
 40
40 -
 41
41 -
 42
42 -
 43
43 -
 44
44 -
 45
45 -
 46
46 -
 47
47 -
 48
48 -
 49
49 -
 50
50 -
 51
51 -
52
-
53
-
54
-
55
-
56
-
57
-
58
-
59
-
60
-
61
-
62
-
63
-
64
-
65
-
66
-
67
-
68
-
69
-
70
-
71
 |
 |

36
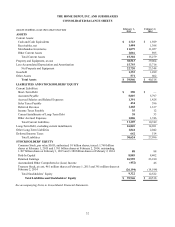
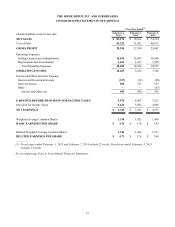
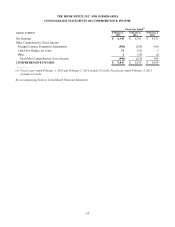
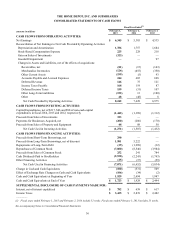
THE HOME DEPOT, INC. AND SUBSIDIARIES
CONSOLIDATED STATEMENTS OF CASH FLOWS
Fiscal Year Ended(1)
amounts in millions February 1,
2015 February 2,
2014 February 3,
2013
CASH FLOWS FROM OPERATING ACTIVITIES:
Net Earnings $ 6,345 $ 5,385 $ 4,535
Reconciliation of Net Earnings to Net Cash Provided by Operating Activities:
Depreciation and Amortization 1,786 1,757 1,684
Stock-Based Compensation Expense 225 228 218
Gain on Sales of Investments (323)— —
Goodwill Impairment —— 97
Changes in Assets and Liabilities, net of the effects of acquisitions:
Receivables, net (81)(15)(143)
Merchandise Inventories (124)(455)(350)
Other Current Assets (199)(5) 93
Accounts Payable and Accrued Expenses 244 605 698
Deferred Revenue 146 75 121
Income Taxes Payable 168 119 87
Deferred Income Taxes 159 (31) 107
Other Long-Term Liabilities (152)13 (180)
Other 48 (48) 8
Net Cash Provided by Operating Activities 8,242 7,628 6,975
CASH FLOWS FROM INVESTING ACTIVITIES:
Capital Expenditures, net of $217, $46 and $98 of non-cash capital
expenditures in fiscal 2014, 2013 and 2012, respectively (1,442)(1,389)(1,312)
Proceeds from Sales of Investments 323 — —
Payments for Businesses Acquired, net (200)(206)(170)
Proceeds from Sales of Property and Equipment 48 88 50
Net Cash Used in Investing Activities (1,271)(1,507)(1,432)
CASH FLOWS FROM FINANCING ACTIVITIES:
Proceeds from Short-Term Borrowings, net 290 — —
Proceeds from Long-Term Borrowings, net of discount 1,981 5,222 —
Repayments of Long-Term Debt (39)(1,289)(32)
Repurchases of Common Stock (7,000)(8,546)(3,984)
Proceeds from Sales of Common Stock 252 241 784
Cash Dividends Paid to Stockholders (2,530)(2,243)(1,743)
Other Financing Activities (25)(37)(59)
Net Cash Used in Financing Activities (7,071)(6,652)(5,034)
Change in Cash and Cash Equivalents (100)(531) 509
Effect of Exchange Rate Changes on Cash and Cash Equivalents (106)(34)(2)
Cash and Cash Equivalents at Beginning of Year 1,929 2,494 1,987
Cash and Cash Equivalents at End of Year $ 1,723 $ 1,929 $ 2,494
SUPPLEMENTAL DISCLOSURE OF CASH PAYMENTS MADE FOR:
Interest, net of interest capitalized $ 782 $ 639 $ 617
Income Taxes $ 3,435 $ 2,839 $ 2,482
—————
(1) Fiscal years ended February 1, 2015 and February 2, 2014 include 52 weeks. Fiscal year ended February 3, 2013 includes 53 weeks.
See accompanying Notes to Consolidated Financial Statements.