Home Depot 2014 Annual Report Download - page 32
Download and view the complete annual report
Please find page 32 of the 2014 Home Depot annual report below. You can navigate through the pages in the report by either clicking on the pages listed below, or by using the keyword search tool below to find specific information within the annual report.-
 1
1 -
2
-
3
-
4
-
5
-
6
-
7
-
8
-
9
-
10
-
11
-
12
-
13
-
14
-
15
-
16
-
17
-
18
-
19
-
20
-
21
-
 22
22 -
 23
23 -
 24
24 -
 25
25 -
 26
26 -
 27
27 -
 28
28 -
 29
29 -
 30
30 -
 31
31 -
 32
32 -
 33
33 -
 34
34 -
 35
35 -
 36
36 -
 37
37 -
 38
38 -
 39
39 -
 40
40 -
 41
41 -
 42
42 -
43
-
44
-
45
-
46
-
47
-
48
-
49
-
50
-
51
-
52
-
53
-
54
-
55
-
56
-
57
-
58
-
59
-
60
-
61
-
62
-
63
-
64
-
65
-
66
-
67
-
68
-
69
-
70
-
71
 |
 |
27
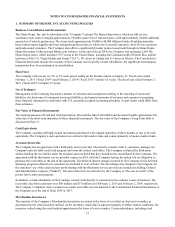
impacted. When we receive payment from customers before the customer has taken possession of the merchandise or the
service has been performed, the amount received is recorded as Deferred Revenue in the accompanying Consolidated
Balance Sheets until the sale or service is complete. We also record Deferred Revenue for the sale of gift cards and recognize
this revenue upon the redemption of gift cards in Net Sales.
Merchandise Inventories
Our Merchandise Inventories are stated at the lower of cost (first-in, first-out) or market, with approximately 74% valued
under the retail inventory method and the remainder under a cost method. Retailers like us, with many different types of
merchandise at low unit cost and a large number of transactions, frequently use the retail inventory method. Under the retail
inventory method, Merchandise Inventories are stated at cost, which is determined by applying a cost-to-retail ratio to the
ending retail value of inventories. As our inventory retail value is adjusted regularly to reflect market conditions, our
inventory valued under the retail method approximates the lower of cost or market. We evaluate our inventory valued under a
cost method at the end of each quarter to ensure that it is carried at the lower of cost or market. The valuation allowance for
Merchandise Inventories valued under a cost method was not material to our Consolidated Financial Statements as of the end
of fiscal 2014 or 2013.
Independent physical inventory counts or cycle counts are taken on a regular basis in each store and distribution center to
ensure that amounts reflected in the accompanying Consolidated Financial Statements for Merchandise Inventories are
properly stated. During the period between physical inventory counts in our stores, we accrue for estimated losses related to
shrink on a store-by-store basis. Shrink (or in the case of excess inventory, "swell") is the difference between the recorded
amount of inventory and the physical inventory. Shrink may occur due to theft, loss, inaccurate records for the receipt of
inventory or deterioration of goods, among other things. We estimate shrink as a percent of Net Sales using the average
shrink results from the previous two physical inventories. The estimates are evaluated quarterly and adjusted based on recent
shrink results and current trends in the business. Actual shrink results did not vary materially from estimated amounts for
fiscal 2014, 2013 or 2012.
Self-Insurance
We have established liabilities for certain losses related to general liability (including product liability), workers’
compensation, employee group medical and automobile claims for which we are self-insured. Our self-insured retention or
deductible, as applicable, for each claim involving general liability, workers' compensation and automobile liability is limited
to $25 million, $1 million and $1 million, respectively. We do not have any stop loss limits for self-insured employee group
medical claims. Our liabilities represent estimates of the ultimate cost for claims incurred as of the balance sheet date. The
estimated liabilities are not discounted and are established based upon analysis of historical data and actuarial estimates. The
liabilities are reviewed by management and third-party actuaries on a regular basis to ensure that they are appropriate. While
we believe these estimates are reasonable based on the information currently available, if actual trends, including the severity
or frequency of claims, medical cost inflation or fluctuations in premiums, differ from our estimates, our results of operations
could be impacted. Actual results related to these types of claims did not vary materially from estimated amounts for fiscal
2014, 2013 or 2012. We maintain network security and privacy liability insurance coverage to limit our exposure to losses
such as those that may be caused by a significant compromise or breach of our data security. This coverage is discussed
further in Note 13 to our Consolidated Financial Statements.
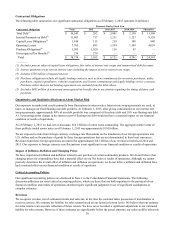
Vendor Allowances
Vendor allowances primarily consist of volume rebates that are earned as a result of attaining certain purchase levels and
advertising co-op allowances for the promotion of vendors’ products that are typically based on guaranteed minimum
amounts with additional amounts being earned for attaining certain purchase levels. These vendor allowances are accrued as
earned, with those allowances received as a result of attaining certain purchase levels accrued over the incentive period based
on estimates of purchases. We believe that our estimate of vendor allowances earned based on expected volume of purchases
over the incentive period is an accurate reflection of the ultimate allowance to be received from our vendors.
Volume rebates and certain advertising co-op allowances earned are initially recorded as a reduction in Merchandise
Inventories and a subsequent reduction in Cost of Sales when the related product is sold. Certain advertising co-op
allowances that are reimbursements of specific, incremental and identifiable costs incurred to promote vendors’ products are
recorded as an offset against advertising expense in SG&A.
Impairment of Long-Lived Assets
We evaluate our long-lived assets each quarter for indicators of potential impairment. Indicators of impairment include
current period losses combined with a history of losses, management’s decision to relocate or close a store or other location