Home Depot 2014 Annual Report Download - page 28
Download and view the complete annual report
Please find page 28 of the 2014 Home Depot annual report below. You can navigate through the pages in the report by either clicking on the pages listed below, or by using the keyword search tool below to find specific information within the annual report.-
 1
1 -
2
-
3
-
4
-
5
-
6
-
7
-
8
-
9
-
10
-
11
-
12
-
13
-
14
-
15
-
16
-
17
-
 18
18 -
 19
19 -
 20
20 -
 21
21 -
 22
22 -
 23
23 -
 24
24 -
 25
25 -
 26
26 -
 27
27 -
 28
28 -
 29
29 -
 30
30 -
 31
31 -
 32
32 -
 33
33 -
 34
34 -
 35
35 -
 36
36 -
 37
37 -
 38
38 -
39
-
40
-
41
-
42
-
43
-
44
-
45
-
46
-
47
-
48
-
49
-
50
-
51
-
52
-
53
-
54
-
55
-
56
-
57
-
58
-
59
-
60
-
61
-
62
-
63
-
64
-
65
-
66
-
67
-
68
-
69
-
70
-
71
 |
 |
23
Fiscal 2013 Compared to Fiscal 2012
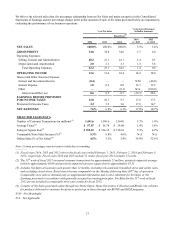
Net Sales
Fiscal 2013 consisted of 52 weeks compared to 53 weeks in fiscal 2012. Net Sales for fiscal 2013 increased 5.4% to $78.8
billion from $74.8 billion for fiscal 2012. The increase in Net Sales for fiscal 2013 reflects the impact of positive comparable
store sales for fiscal 2013, partially offset by $1.2 billion of Net Sales attributable to the additional week in fiscal 2012. Total
comparable store sales increased 6.8% for fiscal 2013 on top of an increase of 4.6% for fiscal 2012.
The positive comparable store sales for fiscal 2013 reflect a number of factors, including the execution of our key initiatives,
continued strength in our core categories and an improved U.S. housing market. All of our departments posted positive
comparable store sales for fiscal 2013. Comparable store sales for our Kitchen, Electrical, Lumber, Plumbing, Lighting, Bath
and Indoor Garden product categories were above or at the Company average for fiscal 2013. Further, our comparable store
customer transactions increased approximately 3.4% for fiscal 2013 and comparable store average ticket increased
approximately 3.3% for fiscal 2013 due in part to strong sales in our appliance business and continued recovery in sales to
our professional customers.
Gross Profit
Gross Profit increased 6.0% to $27.4 billion for fiscal 2013 from $25.8 billion for fiscal 2012. Gross Profit for fiscal 2012
included a $10 million charge related to the closing of our remaining seven big box stores in China ("China store closings")
in fiscal 2012. Gross Profit as a percent of Net Sales was 34.8% for fiscal 2013 compared to 34.6% for fiscal 2012, an
increase of 18 basis points. The increase in gross profit margin in fiscal 2013 was driven primarily by businesses we acquired
in fiscal 2012, which are gross margin accretive, higher productivity in our supply chain and improved shrink performance,
partially offset by a change in the mix of products sold.
Operating Expenses
SG&A increased 0.5% to $16.6 billion for fiscal 2013 from $16.5 billion for fiscal 2012. SG&A for fiscal 2012 included a
$135 million charge related to the China store closings. As a percent of Net Sales, SG&A was 21.1% for fiscal 2013
compared to 22.1% for fiscal 2012. The decrease in SG&A as a percent of Net Sales for fiscal 2013 reflects expense leverage
resulting from the positive comparable store sales environment and strong expense controls.
Depreciation and Amortization was $1.6 billion for both fiscal 2013 and 2012. Depreciation and Amortization as a percent of
Net Sales was 2.1% for both fiscal 2013 and 2012.
Operating Income
Operating Income increased 18.0% to $9.2 billion for fiscal 2013 from $7.8 billion for fiscal 2012. Operating Income as a
percent of Net Sales was 11.6% for fiscal 2013 compared to 10.4% for fiscal 2012.
Interest and Other, net
In fiscal 2013, we recognized $699 million of Interest and Other, net, compared to $545 million for fiscal 2012. Interest and
Other, net, as a percent of Net Sales was 0.9% for fiscal 2013 compared to 0.7% for fiscal 2012. The increase in Interest and
Other, net, as a percent of Net Sales for fiscal 2013 reflects increased interest expense associated with the issuance of $4.0
billion of incremental long-term debt in fiscal 2013. Interest and Other, net, for fiscal 2012 included a $67 million pretax
benefit related to the termination of our guarantee of a senior secured loan of HD Supply, Inc.
Provision for Income Taxes
Our combined effective income tax rate was 36.4% for fiscal 2013 compared to 37.2% for fiscal 2012. The effective income
tax rate for fiscal 2012 was higher than fiscal 2013 as we were unable to realize any tax benefit from the $145 million charge
related to the China store closings for fiscal 2012. Excluding the charge related to the China store closings, our combined
effective income tax rate was 36.5% for fiscal 2012.
Diluted Earnings per Share
Diluted Earnings per Share were $3.76 for fiscal 2013 compared to $3.00 for fiscal 2012. The China store closings had a
negative impact of $0.10 to Diluted Earnings per Share for fiscal 2012. The 53rd week increased Diluted Earnings per Share
by approximately $0.07 for fiscal 2012.