Family Dollar 2012 Annual Report Download - page 69
Download and view the complete annual report
Please find page 69 of the 2012 Family Dollar annual report below. You can navigate through the pages in the report by either clicking on the pages listed below, or by using the keyword search tool below to find specific information within the annual report.-
 1
1 -
2
-
3
-
4
-
5
-
6
-
7
-
8
-
9
-
10
-
11
-
12
-
13
-
14
-
15
-
16
-
17
-
18
-
19
-
20
-
21
-
22
-
23
-
24
-
25
-
26
-
27
-
28
-
29
-
30
-
31
-
32
-
33
-
34
-
35
-
36
-
37
-
38
-
39
-
40
-
41
-
42
-
43
-
44
-
45
-
46
-
47
-
48
-
49
-
50
-
51
-
52
-
53
-
54
-
55
-
56
-
57
-
58
-
 59
59 -
 60
60 -
 61
61 -
 62
62 -
 63
63 -
 64
64 -
 65
65 -
 66
66 -
 67
67 -
 68
68 -
 69
69 -
 70
70 -
 71
71 -
 72
72 -
 73
73 -
 74
74 -
 75
75 -
 76
76 -
 77
77 -
 78
78 -
 79
79 -
80
-
81
-
82
-
83
-
84
 |
 |

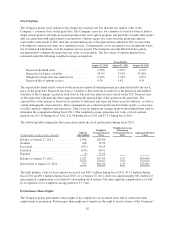
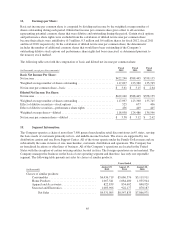
14. Earnings per Share:
Basic net income per common share is computed by dividing net income by the weighted average number of
shares outstanding during each period. Diluted net income per common share gives effect to all securities
representing potential common shares that were dilutive and outstanding during the period. Certain stock options
and performance share rights were excluded from the calculation of diluted net income per common share
because their effects were antidilutive (0.3 million, 0.3 million and 0.6 million shares for fiscal 2012, fiscal 2011
and fiscal 2010, respectively). In the calculation of diluted net income per common share, the denominator
includes the number of additional common shares that would have been outstanding if the Company’s
outstanding dilutive stock options and performance share rights had been exercised, as determined pursuant to
the treasury stock method.
The following table sets forth the computation of basic and diluted net income per common share:
(in thousands, except per share amounts)
Fiscal
2012
Fiscal
2011
Fiscal
2010
Basic Net Income Per Share:
Net income ..................................................... $422,240 $388,445 $358,135
Weighted average number of shares outstanding ........................ 117,097 123,360 135,745
Net income per common share—basic ............................... $ 3.61 $ 3.15 $ 2.64
Diluted Net Income Per Share:
Net income ..................................................... $422,240 $388,445 $358,135
Weighted average number of shares outstanding ........................ 117,097 123,360 135,745
Effect of dilutive securities—stock options ............................ 525 677 406
Effect of dilutive securities—performance share rights .................. 436 449 445
Weighted average shares—diluted ................................... 118,058 124,486 136,596
Net income per common share—diluted .............................. $ 3.58 $ 3.12 $ 2.62
15. Segment Information:
The Company operates a chain of more than 7,400 general merchandise retail discount stores in 45 states, serving
the basic needs of customers primarily in low- and middle-income brackets. The stores are supported by ten
distribution centers and one Store Support Center. All of the stores operate under the Family Dollar name and are
substantially the same in terms of size, merchandise, customers, distribution and operations. The Company has
no franchised locations or other lines of business. All of the Company’s operations are located in the United
States with the exception of certain sourcing entities located in Asia. The foreign operations are not material. The
Company manages the business on the basis of one operating segment and therefore, has only one reportable
segment. The following table presents net sales by classes of similar products.
Years Ended
(in thousands)
August 25,
2012
August 27,
2011
August 28,
2010
Classes of similar products:
Consumables ................................ $6,436,719 $5,686,576 $5,119,911
Home Products .............................. 1,067,541 1,084,480 1,035,944
Apparel and Accessories ....................... 822,839 854,602 840,929
Seasonal and Electronics ....................... 1,003,906 922,177 870,187
Net Sales ............................... $9,331,005 $8,547,835 $7,866,971
65