Family Dollar 2012 Annual Report Download - page 33
Download and view the complete annual report
Please find page 33 of the 2012 Family Dollar annual report below. You can navigate through the pages in the report by either clicking on the pages listed below, or by using the keyword search tool below to find specific information within the annual report.-
 1
1 -
2
-
3
-
4
-
5
-
6
-
7
-
8
-
9
-
10
-
11
-
12
-
13
-
14
-
15
-
16
-
17
-
18
-
19
-
20
-
21
-
22
-
 23
23 -
 24
24 -
 25
25 -
 26
26 -
 27
27 -
 28
28 -
 29
29 -
 30
30 -
 31
31 -
 32
32 -
 33
33 -
 34
34 -
 35
35 -
 36
36 -
 37
37 -
 38
38 -
 39
39 -
 40
40 -
 41
41 -
 42
42 -
 43
43 -
44
-
45
-
46
-
47
-
48
-
49
-
50
-
51
-
52
-
53
-
54
-
55
-
56
-
57
-
58
-
59
-
60
-
61
-
62
-
63
-
64
-
65
-
66
-
67
-
68
-
69
-
70
-
71
-
72
-
73
-
74
-
75
-
76
-
77
-
78
-
79
-
80
-
81
-
82
-
83
-
84
 |
 |
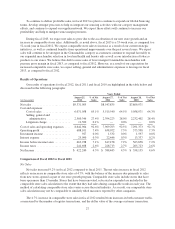
Interest Expense
Interest expense increased $2.6 million in fiscal 2012 compared to fiscal 2011. On January 28, 2011, we
issued $300 million in senior unsecured notes with a coupon rate of 5.00% maturing in 2021 (the “2021 Notes”).
The interest in interest expense in fiscal 2012, as compared to fiscal 2011, was primarily driven by the interest
expense on the 2021 Notes.
Income Taxes
The effective tax rate was 36.4% for fiscal 2012 compared to 37.1% in fiscal 2011. The decrease in the
effective tax rate in fiscal 2012, as compared to fiscal 2011, was due primarily to foreign tax benefits realized in
connection with the Company’s global sourcing efforts and a decrease in liabilities for uncertain tax positions.
Comparison of Fiscal 2011 to Fiscal 2010
Net Sales
Net sales increased 8.7% in fiscal 2011 compared to fiscal 2010. The net sales increase in fiscal 2011
reflects an increase in comparable store sales of 5.5%, with the balance of the increase due primarily to sales
from new stores opened as part of our store growth program.
The 5.5% increase in comparable store sales in fiscal 2011 resulted from increases in both customer traffic,
as measured by the number of register transactions, and the dollar value of the average customer transaction.
During fiscal 2011, the customer count increased approximately 4.0%, and the average customer transaction
increased approximately 1.5% compared to fiscal 2010. Sales during fiscal 2011 were strongest in the
Consumables category.
During fiscal 2011, we opened 300 stores and closed 62 stores for a net addition of 238 stores, compared
with the opening of 200 stores and closing of 70 stores for a net addition of 130 stores during fiscal 2010.
Cost of Sales
Cost of sales increased 9.0% in fiscal 2011 compared to fiscal 2010. The increase was due primarily to
additional sales volume. Cost of sales, as a percentage of net sales, was 64.5% in fiscal 2011 compared to 64.3%
in fiscal 2010. The increase in cost of sales, as a percentage of net sales in fiscal 2011, as compared to fiscal
2010, was a result of the impact of stronger sales in lower margin consumables merchandise and increased
freight costs. These pressures were partially offset by lower inventory shrinkage and an increase in the markup of
sales of merchandise. The growth in sales of lower-margin consumables (66.5% of net sales in fiscal 2011
compared with 65.1% of net sales in fiscal 2010) pressured gross profit as a percentage of net sales. Freight costs
were negatively impacted by higher diesel costs. We believe that inventory shrinkage benefited from workforce
stabilization in our stores and improved analytics and monitoring processes. We continue to focus on improving
our purchase mark-ups through our price management, the continued development of our private brand
assortment, and our global sourcing efforts.
Selling, General and Administrative Expenses
SG&A expenses increased 7.2% in fiscal 2011 compared to fiscal 2010. The increase in these expenses was
due in part to additional sales volume and additional costs arising from the continued growth in the number of
stores in operation. SG&A expenses, as a percentage of net sales, were 28.0% in fiscal 2011 compared to 28.4%
in fiscal 2010. Most expenses in fiscal 2011 were leveraged as a result of a 5.5% increase in comparable store
sales and continued productivity improvements. The increased comparable store sales volumes helped offset our
investments to drive revenue growth, including store renovations, extended store hours and enhanced marketing
efforts. In addition, SG&A expenses, as a percentage of net sales, were leveraged as a result of lower non-store
payroll costs, including incentive compensation expense, (approximately 0.3% of net sales) in fiscal 2011, as
29