Family Dollar 2012 Annual Report Download - page 48
Download and view the complete annual report
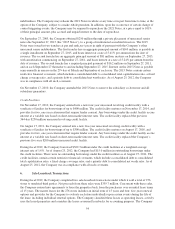
Please find page 48 of the 2012 Family Dollar annual report below. You can navigate through the pages in the report by either clicking on the pages listed below, or by using the keyword search tool below to find specific information within the annual report.-
 1
1 -
2
-
3
-
4
-
5
-
6
-
7
-
8
-
9
-
10
-
11
-
12
-
13
-
14
-
15
-
16
-
17
-
18
-
19
-
20
-
21
-
22
-
23
-
24
-
25
-
26
-
27
-
28
-
29
-
30
-
31
-
32
-
33
-
34
-
35
-
36
-
37
-
 38
38 -
 39
39 -
 40
40 -
 41
41 -
 42
42 -
 43
43 -
 44
44 -
 45
45 -
 46
46 -
 47
47 -
 48
48 -
 49
49 -
 50
50 -
 51
51 -
 52
52 -
 53
53 -
 54
54 -
 55
55 -
 56
56 -
 57
57 -
 58
58 -
59
-
60
-
61
-
62
-
63
-
64
-
65
-
66
-
67
-
68
-
69
-
70
-
71
-
72
-
73
-
74
-
75
-
76
-
77
-
78
-
79
-
80
-
81
-
82
-
83
-
84
 |
 |

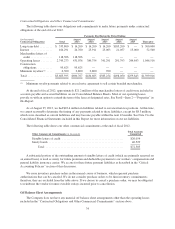
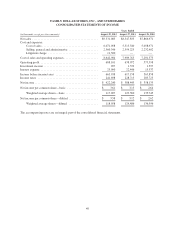
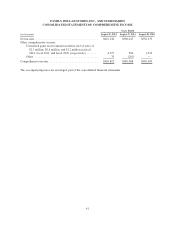
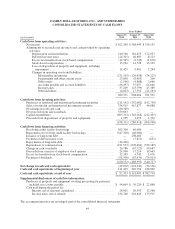
FAMILY DOLLAR STORES, INC., AND SUBSIDIARIES
CONSOLIDATED STATEMENTS OF CASH FLOWS
Years Ended
(in thousands)
August 25,
2012
August 27,
2011
August 28,
2010
Cash flows from operating activities:
Net income .................................................. $422,240 $ 388,445 $ 358,135
Adjustments to reconcile net income to net cash provided by operating
activities:
Depreciation and amortization ............................... 210,748 182,455 172,037
Deferred income taxes ..................................... (24,321) 46,805 8,123
Excess tax benefits from stock-based compensation .............. (12,345) (4,745) (1,676)
Stock-based compensation .................................. 15,902 14,728 13,163
Loss on disposition of property and equipment, including
impairment ............................................ 11,429 9,461 7,244
Changes in operating assets and liabilities:
Merchandise inventories ............................... (271,503) (126,638) (34,225)
Prepayments and other current assets ..................... 23,838 (8,409) 200
Other assets ......................................... (2,506) (4,888) 2,666
Accounts payable and accrued liabilities ................... (36,497) 37,057 61,646
Income taxes ......................................... 37,209 (23,799) 25,389
Other liabilities ....................................... (4,823) 17,592 (21,163)
369,371 528,064 591,539
Cash flows from investing activities:
Purchases of restricted and unrestricted investment securities .......... (211,142) (352,082) (142,730)
Sales of restricted and unrestricted investment securities .............. 334,915 415,877 46,888
Net change in restricted cash .................................... (80,389) — —
Net proceeds from sale-leaseback ................................ 359,663 — —
Capital expenditures ........................................... (603,313) (345,268) (212,435)
Proceeds from dispositions of property and equipment ................ 1,955 1,055 1,329
(198,311) (280,418) (306,948)
Cash flows from financing activities:
Revolving credit facility borrowings .............................. 362,300 46,000 —
Repayment of revolving credit facility borrowings ................... (347,300) (46,000) —
Issuance of long-term debt ...................................... — 298,482 —
Payment of debt issuance costs .................................. — (7,811) (651)
Repayments of long-term debt ................................... (16,200) — —
Repurchases of common stock ................................... (191,573) (670,466) (332,189)
Change in cash overdrafts ...................................... 26,786 (47,722) 49,687
Proceeds from exercise of employee stock options ................... 24,900 17,216 19,663
Excess tax benefits from stock-based compensation .................. 12,345 4,745 1,676
Payment of dividends .......................................... (91,390) (83,439) (78,913)
(220,132) (488,995) (340,727)
Net change in cash and cash equivalents ............................. (49,072) (241,349) (56,136)
Cash and cash equivalents at beginning of year ....................... 141,405 382,754 438,890
Cash and cash equivalents at end of year ............................ $ 92,333 $ 141,405 $ 382,754
Supplemental disclosures of cash flow information:
Purchases of property and equipment awaiting processing for payment,
included in accounts payable .................................. $ 54,609 $ 36,220 $ 22,848
Cash paid during the period for:
Interest, net of amounts capitalized ........................... 24,001 20,395 12,568
Income taxes, net of refunds ................................ 234,740 201,843 175,915
The accompanying notes are an integral part of the consolidated financial statements.
44