Family Dollar 2012 Annual Report Download - page 32
Download and view the complete annual report
Please find page 32 of the 2012 Family Dollar annual report below. You can navigate through the pages in the report by either clicking on the pages listed below, or by using the keyword search tool below to find specific information within the annual report.-
 1
1 -
2
-
3
-
4
-
5
-
6
-
7
-
8
-
9
-
10
-
11
-
12
-
13
-
14
-
15
-
16
-
17
-
18
-
19
-
20
-
21
-
 22
22 -
 23
23 -
 24
24 -
 25
25 -
 26
26 -
 27
27 -
 28
28 -
 29
29 -
 30
30 -
 31
31 -
 32
32 -
 33
33 -
 34
34 -
 35
35 -
 36
36 -
 37
37 -
 38
38 -
 39
39 -
 40
40 -
 41
41 -
 42
42 -
43
-
44
-
45
-
46
-
47
-
48
-
49
-
50
-
51
-
52
-
53
-
54
-
55
-
56
-
57
-
58
-
59
-
60
-
61
-
62
-
63
-
64
-
65
-
66
-
67
-
68
-
69
-
70
-
71
-
72
-
73
-
74
-
75
-
76
-
77
-
78
-
79
-
80
-
81
-
82
-
83
-
84
 |
 |
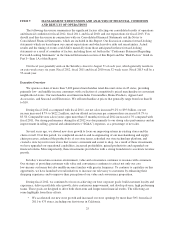
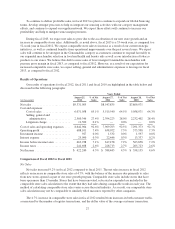
During fiscal 2012, the customer count increased approximately 2.7%, and the average customer transaction
increased approximately 2.0% compared to fiscal 2011. Sales during fiscal 2012 were strongest in the
Consumables category.
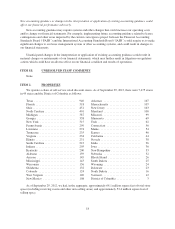
During fiscal 2012, we opened 475 stores and closed 56 stores for a net addition of 419 stores, compared
with the opening of 300 stores and closing of 62 stores for a net addition of 238 stores during fiscal 2011.
Cost of Sales
Cost of sales increased 10.1% in fiscal 2012 compared to fiscal 2011. The increase was due primarily to
additional sales volume. Cost of sales, as a percentage of net sales, was 65.1% in fiscal 2012 compared to 64.5%
in fiscal 2011. Cost of sales, as a percentage of net sales, was negatively impacted by the shift in sales mix to
lower-margin consumable merchandise, an increase in inventory shrinkage, and higher markdowns. These
pressures were partially offset by an increase in the markups on the sales of merchandise. The growth in sales of
lower-margin consumables (69.0% of net sales in fiscal 2012 compared with 66.5% of net sales in fiscal 2011)
continues to pressure gross profit as a percentage of net sales. Inventory shrinkage increased during fiscal 2012
as a result of increased activities in the stores including renovations and significant merchandise expansions. We
continue to use markdowns in our stores to drive revenue growth during challenging macro-economic times as
well as increase market share. We continue to focus on improving our purchase markups through the continued
development of our private brand assortment, the expansion of our global sourcing efforts, and improved price
management capabilities.
Selling, General and Administrative Expenses
SG&A expenses increased 6.9% in fiscal 2012 compared to fiscal 2011. The increase in these expenses was
due in part to additional sales volume and additional costs arising from the continued growth in the number of
stores in operation. SG&A expenses, as a percentage of net sales, were 27.4% in fiscal 2012 compared to 28.0%
in fiscal 2011. Most expenses in fiscal 2012 were leveraged as a result of a 4.7% increase in comparable store
sales and continued productivity improvements. In addition, SG&A expenses, as a percentage of net sales, were
leveraged as a result of a decrease in store payroll costs (approximately 0.3% of net sales) and a decrease in
insurance expense (approximately 0.2% of net sales). These improvements were partially offset by increased
marketing expense (approximately 0.1% of net sales) in fiscal 2012, as compared to fiscal 2011. The decrease in
store payroll costs was a result of the continued benefit from improvements implemented to re-engineer many of
our core store processes, which has increased workforce productivity. Insurance expense continues to benefit
from favorable trends in workers’ compensation and general liability costs reflecting improvements we have
made in our store operations and risk management processes. Our marketing expense increased as a percentage
of net sales as we expanded our customer communications, leveraged various marketing vehicles and improved
our marketing and promotional materials.
Litigation Charge
During the fourth quarter of fiscal 2012, we recorded an $11.5 million (approximately $0.06 per diluted
share) litigation charge associated with the preliminary settlement of a lawsuit in the state of New York. This
lawsuit involves claims for overtime pay from New York store managers who worked in our stores over the past
nine years. See note 11 of the Consolidated Financial Statements for more information.
Investment Income
The change in investment income in fiscal 2012, as compared to fiscal 2011, was not material.
28