Family Dollar 2012 Annual Report Download - page 29
Download and view the complete annual report
Please find page 29 of the 2012 Family Dollar annual report below. You can navigate through the pages in the report by either clicking on the pages listed below, or by using the keyword search tool below to find specific information within the annual report.-
 1
1 -
2
-
3
-
4
-
5
-
6
-
7
-
8
-
9
-
10
-
11
-
12
-
13
-
14
-
15
-
16
-
17
-
18
-
 19
19 -
 20
20 -
 21
21 -
 22
22 -
 23
23 -
 24
24 -
 25
25 -
 26
26 -
 27
27 -
 28
28 -
 29
29 -
 30
30 -
 31
31 -
 32
32 -
 33
33 -
 34
34 -
 35
35 -
 36
36 -
 37
37 -
 38
38 -
 39
39 -
40
-
41
-
42
-
43
-
44
-
45
-
46
-
47
-
48
-
49
-
50
-
51
-
52
-
53
-
54
-
55
-
56
-
57
-
58
-
59
-
60
-
61
-
62
-
63
-
64
-
65
-
66
-
67
-
68
-
69
-
70
-
71
-
72
-
73
-
74
-
75
-
76
-
77
-
78
-
79
-
80
-
81
-
82
-
83
-
84
 |
 |

ITEM 7. MANAGEMENT’S DISCUSSION AND ANALYSIS OF FINANCIAL CONDITION
AND RESULTS OF OPERATIONS
The following discussion summarizes the significant factors affecting our consolidated results of operations
and financial condition for fiscal 2012, fiscal 2011, and fiscal 2010, and our expectations for fiscal 2013. You
should read this discussion in conjunction with our Consolidated Financial Statements and the Notes to
Consolidated Financial Statements, which are included in this Report. Our discussion contains forward-looking
statements which are based upon our current expectations and which involve risks and uncertainties. Actual
results and the timing of events could differ materially from those anticipated in these forward-looking
statements as a result of a number of factors, including those set forth in the “Cautionary Statement Regarding
Forward-Looking Statements” in the General Information section of this Report and the “Risk Factors” listed in
Part I—Item 1A of this Report.
Our fiscal year generally ends on the Saturday closest to August 31 of each year, which generally results in
an extra week every six years. Fiscal 2012, fiscal 2011 and fiscal 2010 were 52-week years. Fiscal 2013 will be a
53-week year.
Executive Overview
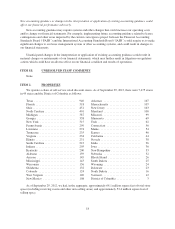
We operate a chain of more than 7,400 general merchandise retail discount stores in 45 states, providing
primarily low- and middle-income consumers with a selection of competitively priced merchandise in convenient
neighborhood stores. Our merchandise assortment includes Consumables, Home Products, Apparel and
Accessories, and Seasonal and Electronics. We sell merchandise at prices that generally range from less than $1
to $10.
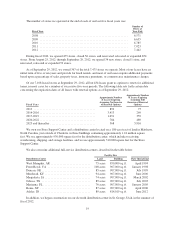
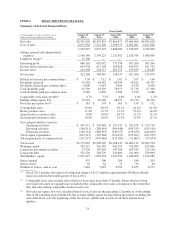
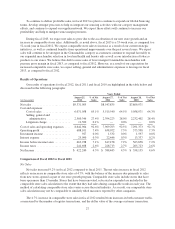
During fiscal 2012 as compared with fiscal 2011, our net sales increased 9.2% to $9.3 billion, our net
income increased 8.7% to $422.2 million, and our diluted net income per common share increased 14.7% to
$3.58. Comparable store sales (stores open more than 13 months) for fiscal 2012 increased 4.7% compared with
fiscal 2011. Our strong performance during fiscal 2012 was due primarily to our strong sales performance and an
improvement in selling, general and administrative (“SG&A”) expenses, as a percentage of net sales.
Several years ago, we slowed new store growth to focus on improving returns in existing stores and the
chain overall. Over this period, we completed an end-to-end re-engineering of our merchandising and supply
chain processes, enhanced the productivity of our store teams, refreshed our store technology platform, and
created a store layout for new stores that is more convenient and easier to shop. As a result of these investments,
we have upgraded our operational capabilities, increased profitability, gained productivity and expanded our
financial returns. More importantly, these investments provided us with a strong foundation to accelerate revenue
growth.
In today’s uncertain economic environment, value and convenience continues to resonate with consumers.
Our strategy of providing customers with value and convenience continues to attract not only our core
low-income customers but also middle-income families with greater frequency. To continue to capitalize on this
opportunity, we have launched several initiatives to increase our relevancy to customers by enhancing their
shopping experience and to improve their perception of our value and convenience proposition.
During fiscal 2012, we continued to focus on achieving our four corporate goals: build customer loyalty and
experience; deliver profitable sales growth; drive continuous improvement; and develop diverse, high performing
teams. These goals are designed to drive both short-term and longer-term financial results. The following are
some highlights from these efforts.
• We accelerated our new store growth and increased our store openings by more than 50% from fiscal
2011 to 475 stores, including our first stores in California.
25