Family Dollar 2012 Annual Report Download - page 28
Download and view the complete annual report
Please find page 28 of the 2012 Family Dollar annual report below. You can navigate through the pages in the report by either clicking on the pages listed below, or by using the keyword search tool below to find specific information within the annual report.-
 1
1 -
2
-
3
-
4
-
5
-
6
-
7
-
8
-
9
-
10
-
11
-
12
-
13
-
14
-
15
-
16
-
17
-
 18
18 -
 19
19 -
 20
20 -
 21
21 -
 22
22 -
 23
23 -
 24
24 -
 25
25 -
 26
26 -
 27
27 -
 28
28 -
 29
29 -
 30
30 -
 31
31 -
 32
32 -
 33
33 -
 34
34 -
 35
35 -
 36
36 -
 37
37 -
 38
38 -
39
-
40
-
41
-
42
-
43
-
44
-
45
-
46
-
47
-
48
-
49
-
50
-
51
-
52
-
53
-
54
-
55
-
56
-
57
-
58
-
59
-
60
-
61
-
62
-
63
-
64
-
65
-
66
-
67
-
68
-
69
-
70
-
71
-
72
-
73
-
74
-
75
-
76
-
77
-
78
-
79
-
80
-
81
-
82
-
83
-
84
 |
 |

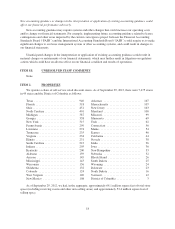
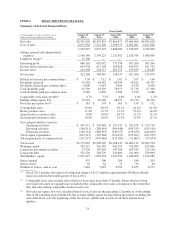
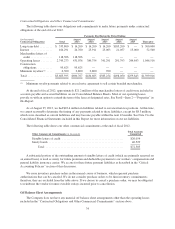
ITEM 6. SELECTED FINANCIAL DATA
Summary of Selected Financial Data
Years Ended
(in thousands, except per share, store,
and net sales per square foot data)
August 25,
2012
August 27,
2011
August 28,
2010
August 29,
2009
August 30,
2008
Net sales ............................ $9,331,005 $8,547,835 $7,866,971 $7,400,606 $6,983,628
Cost of sales ......................... 6,071,058 5,515,540 5,058,971 4,822,401 4,637,826
3,259,947 3,032,295 2,808,000 2,578,205 2,345,802
Selling, general and administrative
expenses .......................... 2,560,346 2,394,223 2,232,402 2,120,936 1,980,496
Litigation charge(1) .................... 11,500 ————
Operating profit ....................... 688,101 638,072 575,598 457,269 365,306
Income before income taxes ............. 663,938 617,158 563,858 450,925 361,762
Income taxes ......................... 241,698 228,713 205,723 159,659 128,689
Net income .......................... 422,240 388,445 358,135 291,266 233,073
Diluted net income per common share ..... $ 3.58 $ 3.12 $ 2.62 $ 2.07 $ 1.66
Dividends declared .................... 70,302 84,342 80,394 74,013 68,537
Dividends declared per common share ..... 0.600 0.695 0.600 0.530 0.490
Cash dividends paid ................... 91,390 83,439 78,913 72,738 67,408
Cash dividends paid per common share .... 0.780 0.670 0.580 0.520 0.480
Comparable store sales growth(2) ......... 4.7% 5.5% 4.8% 4.0% 1.2%
Ending selling square feet ............... 53,207 49,996 48,225 47,120 46,324
Net sales per square foot(3) .............. $ 181 $ 174 $ 165 $ 158 $ 152
Consumables sales ..................... 69.0% 66.5% 65.1% 64.4% 61.0%
Home products sales ................... 11.4% 12.7% 13.2% 13.4% 14.4%
Apparel and accessories sales ............ 8.8% 10.0% 10.7% 11.2% 13.1%
Seasonal and electronics sales ............ 10.8% 10.8% 11.0% 11.0% 11.5%
Net cash provided by (used in):
Operating activities ................ $ 369,371 $ 528,064 $ 591,539 $ 529,199 $ 515,738
Investing activities ................ (198,311) (280,418) (306,948) (109,355) (199,556)
Financing activities ................ (220,132) (488,995) (340,727) (139,456) (244,856)
Total capital expenditures ............... (603,313) (345,268) (212,435) (155,401) (167,932)
Total repurchases of common stock ....... (191,573) (670,466) (332,189) (71,067) (97,674)
Total assets .......................... $3,373,065 $2,996,205 $2,968,145 $2,864,112 $2,689,354
Working capital ....................... 702,513 516,789 641,527 718,509 453,806
Long-term investment securities .......... 23,720 107,458 147,108 163,545 222,104
Long-term debt ....................... 532,520 548,570 250,000 250,000 250,000
Shareholders’ equity ................... 1,297,627 1,087,074 1,421,554 1,440,060 1,254,083
Stores opened ........................ 475 300 200 180 205
Stores closed ......................... 56 62 70 96 64
Number of stores—end of year ........... 7,442 7,023 6,785 6,655 6,571
(1) Fiscal 2012 includes the impact of a litigation charge of $11.5 million (approximately $0.06 per diluted
share) recorded in the fourth quarter of fiscal 2012.
(2) Comparable store sales include stores that have been open more than 13 months. Stores that have been
renovated, relocated or expanded are included in the comparable store sales calculation to the extent that
they had sales during comparable weeks in each year.
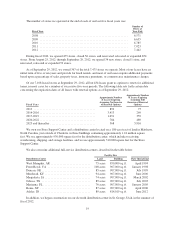
(3) Net sales per square foot was calculated based on total sales for the preceding 12 months as of the ending
date of the reporting period divided by the average selling square footage during the period, including the
end of the fiscal year, the beginning of the fiscal year, and the end of each of our three interim fiscal
quarters.
24