Family Dollar 2012 Annual Report Download - page 57
Download and view the complete annual report
Please find page 57 of the 2012 Family Dollar annual report below. You can navigate through the pages in the report by either clicking on the pages listed below, or by using the keyword search tool below to find specific information within the annual report.-
 1
1 -
2
-
3
-
4
-
5
-
6
-
7
-
8
-
9
-
10
-
11
-
12
-
13
-
14
-
15
-
16
-
17
-
18
-
19
-
20
-
21
-
22
-
23
-
24
-
25
-
26
-
27
-
28
-
29
-
30
-
31
-
32
-
33
-
34
-
35
-
36
-
37
-
38
-
39
-
40
-
41
-
42
-
43
-
44
-
45
-
46
-
 47
47 -
 48
48 -
 49
49 -
 50
50 -
 51
51 -
 52
52 -
 53
53 -
 54
54 -
 55
55 -
 56
56 -
 57
57 -
 58
58 -
 59
59 -
 60
60 -
 61
61 -
 62
62 -
 63
63 -
 64
64 -
 65
65 -
 66
66 -
 67
67 -
68
-
69
-
70
-
71
-
72
-
73
-
74
-
75
-
76
-
77
-
78
-
79
-
80
-
81
-
82
-
83
-
84
 |
 |

Proceeds from sales of investment securities available-for-sale during fiscal 2012 were $334.9 million compared
to $415.9 million in fiscal 2011 and $46.9 million in fiscal 2010. No gains or losses were realized on those sales
for fiscal 2012, fiscal 2011 and fiscal 2010.
The Company also holds investments in mutual funds in connection with a deferred compensation plan for
certain key management employees. These investments are classified as trading securities and are included, at
fair value, in other assets on the Consolidated Balance Sheets. The Company records an offsetting deferred
compensation liability in Other Liabilities. The fair value of the deferred compensation plan assets was $17.9
million as of the end of fiscal 2012 and $15.6 million as of the end of fiscal 2011. See Note 10 below for more
information on the deferred compensation plan.
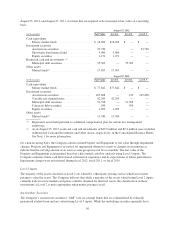
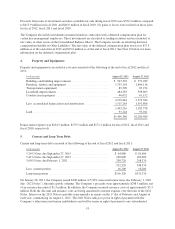
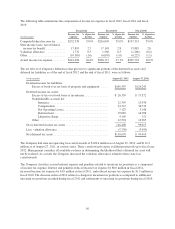
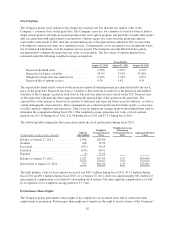
4. Property and Equipment:
Property and equipment is recorded at cost and consisted of the following at the end of fiscal 2012 and fiscal
2011:
(in thousands) August 25, 2012 August 27, 2011
Buildings and building improvements ......................... $ 543,392 $ 572,039
Furniture, fixtures and equipment ............................ 1,755,154 1,460,116
Transportation equipment .................................. 89,520 87,274
Leasehold improvements ................................... 484,383 398,803
Construction in progress ................................... 46,032 61,152
2,918,481 2,579,384
Less: accumulated depreciation and amortization ................ 1,515,265 1,391,806
1,403,216 1,187,578
Land ................................................... 93,144 93,011
$1,496,360 $1,280,589
Depreciation expense was $204.5 million, $179.5 million and $171.2 million for fiscal 2012, fiscal 2011 and
fiscal 2010, respectively.
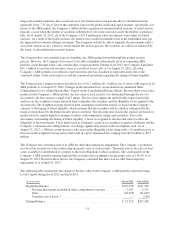
5. Current and Long-Term Debt:
Current and long-term debt consisted of the following at the end of fiscal 2012 and fiscal 2011:
(in thousands) August 25, 2012 August 27, 2011
5.24% Notes due September 27, 2015 ......................... $ 64,800 $ 81,000
5.41% Notes due September 27, 2015 ......................... 169,000 169,000
5.00% Notes due February 1, 2021 ........................... 298,720 298,570
532,520 548,570
Less: current portion ...................................... 16,200 16,200
Long-term portion ........................................ $516,320 $532,370
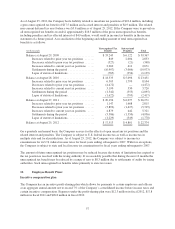
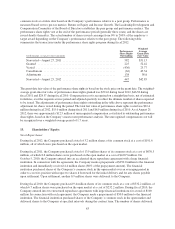
On January 28, 2011, the Company issued $300 million of 5.00% unsecured senior notes due February 1, 2021
(the “2021 Notes”), through a public offering. The Company’s proceeds were approximately $298.5 million, net
of an issuance discount of $1.5 million. In addition, the Company incurred issuance costs of approximately $3.3
million. Both the discount and issuance costs are being amortized to interest expense over the term of the 2021
Notes. Interest on the 2021 Notes is payable semi-annually in arrears on the 1st day of February and August of
each year, commencing on August 1, 2011. The 2021 Notes rank pari passu in right of payment with the
Company’s other unsecured senior indebtedness and will be senior in right of payment to any subordinated
53