Family Dollar 2012 Annual Report Download - page 37
Download and view the complete annual report
Please find page 37 of the 2012 Family Dollar annual report below. You can navigate through the pages in the report by either clicking on the pages listed below, or by using the keyword search tool below to find specific information within the annual report.-
 1
1 -
2
-
3
-
4
-
5
-
6
-
7
-
8
-
9
-
10
-
11
-
12
-
13
-
14
-
15
-
16
-
17
-
18
-
19
-
20
-
21
-
22
-
23
-
24
-
25
-
26
-
 27
27 -
 28
28 -
 29
29 -
 30
30 -
 31
31 -
 32
32 -
 33
33 -
 34
34 -
 35
35 -
 36
36 -
 37
37 -
 38
38 -
 39
39 -
 40
40 -
 41
41 -
 42
42 -
 43
43 -
 44
44 -
 45
45 -
 46
46 -
 47
47 -
48
-
49
-
50
-
51
-
52
-
53
-
54
-
55
-
56
-
57
-
58
-
59
-
60
-
61
-
62
-
63
-
64
-
65
-
66
-
67
-
68
-
69
-
70
-
71
-
72
-
73
-
74
-
75
-
76
-
77
-
78
-
79
-
80
-
81
-
82
-
83
-
84
 |
 |
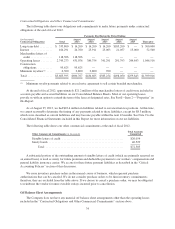
not have a stated expiration date, and purchases may be made through open market purchases, private market
transactions or other structured transactions.
In addition to the Restricted Cash and Investments noted above, our wholly-owned captive insurance
subsidiary maintains additional balances in cash and cash equivalents and investment securities that are used in
connection with our retained workers’ compensation, general liability and automobile liability risks and are not
designated for general corporate purposes. As of the end of fiscal 2012, these cash and cash equivalents and
investment securities balances (including Restricted Cash and Investments) were $19.0 million, and $85.3
million, respectively.
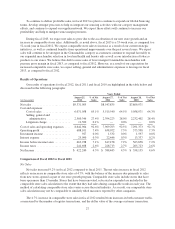
Cash Flows from Operating Activities
Cash provided by operating activities decreased $158.7 million during fiscal 2012, as compared to fiscal
2011. The decrease was due primarily to an increase in merchandise inventories in fiscal 2012 as noted above,
and a decrease in accounts payable and accrued liabilities, which was offset partially by changes in prepayments
and other current assets and higher net income, all in the ordinary course of business.
Cash provided by operating activities decreased $63.5 million during fiscal 2011, as compared to fiscal
2010. The decrease was due primarily to an increase in merchandise inventories primarily offset by changes in
other liabilities and higher net income, all in the ordinary course of business.
Cash Flows from Investing Activities
Cash used in investing activities decreased $82.1 million during fiscal 2012, as compared to fiscal 2011. The
change was due to the net proceeds received from the sale-leaseback transaction of $359.7 million, offset
partially by an increase in capital expenditures. The increase in capital expenditures during fiscal 2012 are
discussed above.
Cash used in investing activities decreased $26.5 million during fiscal 2011, as compared to fiscal 2010. The
change was due primarily to a net increase in sales of investment securities in fiscal 2011, as compared to fiscal
2010, offset by an increase in capital expenditures of $132.8 million. The net increase in sales of investment
securities was due to the continued liquidation of our auction rate securities and the increase in capital
expenditures as discussed above.
Cash Flows from Financing Activities
Cash used in financing activities decreased $268.9 million during fiscal 2012, as compared to fiscal 2011.
We purchased $191.6 million of our common stock during fiscal 2012 as compared to $670.5 million in fiscal
2011, a decrease in share repurchases of $478.9 million. In addition, during fiscal 2011, we issued $300 million
of 5.00% unsecured senior notes, creating a significant cash inflow from financing activities in fiscal 2011,
which offset the decrease in share repurchases.
Cash used in financing activities increased $148.3 million during fiscal 2011, as compared to fiscal 2010.
The increase was primarily due to an increase in repurchases of common stock and changes in cash overdrafts,
partially offset by the issuance of new debt. During fiscal 2011, we purchased $670.5 million of our common
stock, as compared to $332.2 million in fiscal 2010. Cash overdrafts decreased $47.7 million in fiscal 2011, as
compared to an increase of $49.7 million in fiscal 2010. See Note 1 to the Consolidated Financial Statements
included in this report for an explanation of our cash overdrafts. Additionally, as noted above, in fiscal 2011 we
issued $300 million of 5.00% unsecured senior notes, creating a significant cash inflow from financing activities
as compared to fiscal 2010.
33