Energizer 2007 Annual Report Download - page 42
Download and view the complete annual report
Please find page 42 of the 2007 Energizer annual report below. You can navigate through the pages in the report by either clicking on the pages listed below, or by using the keyword search tool below to find specific information within the annual report.-
 1
1 -
2
-
3
-
4
-
5
-
6
-
7
-
8
-
9
-
10
-
11
-
12
-
13
-
14
-
15
-
16
-
17
-
18
-
19
-
20
-
21
-
22
-
23
-
24
-
25
-
26
-
27
-
28
-
29
-
30
-
31
-
 32
32 -
 33
33 -
 34
34 -
 35
35 -
 36
36 -
 37
37 -
 38
38 -
 39
39 -
 40
40 -
 41
41 -
 42
42 -
 43
43 -
 44
44 -
 45
45 -
 46
46 -
 47
47
 |
 |

40
Energizer Holdings, Inc. 2007 Annual Report
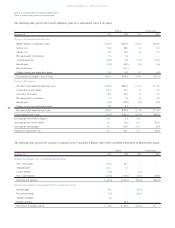
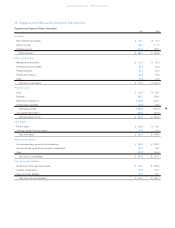
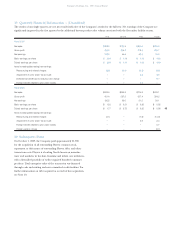
Allowance for Doubtful Accounts
2007 2006 2005
Balance at beginning of year $ 10.9 $ 12.5 $ 15.0
Provision charged to expense, net of reversals (0.2) –0.8
Write-offs, less recoveries (0.9) (1.6) (3.3)
Balance at end of year $9.8 $ 10.9 $ 12.5
Income Tax Valuation Allowance
2007 2006 2005
Balance at beginning of year $ 10.7 $ 15.1 $ 24.7
Provision charged to expense 0.5 1.8 4.9
Reversal of provision charged to expense (4.3) (5.7) (14.7)
Write-offs, translation, other (2.0) (0.5) 0.2
Balance at end of year $4.9 $ 10.7 $ 15.1
Supplemental Cash Flow Statement Information
2007 2006 2005
Interest paid $ 90.4 $ 66.7 $ 48.1
Income taxes paid 108.5 113.3 86.4
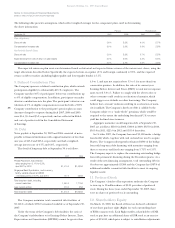
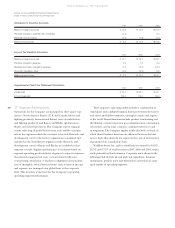
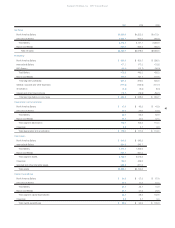
17. Segment Information
Operations for the Company are managed via three major seg-
ments – North America Battery (U.S. and Canada battery and
lighting products), International Battery (rest of world battery
and lighting products) and Razors and Blades (global razors,
blades, and related products). The Company reports segment
results reflecting all profit derived from each outside customer
sale in the region in which the customer is located. Research and
development costs for the battery segments are combined and
included in the Total Battery segment results. Research and
development costs for Razors and Blades are included in that
segment’s results. Segment performance is evaluated based on
segment operating profit exclusive of general corporate expenses,
share-based compensation costs, costs associated with most
restructuring, integration or business realignment and amortiza-
tion of intangible assets. Financial items, such as interest income
and expense, are managed on a global basis at the corporate
level. This structure is the basis for the Company’s reportable
operating segment information.
The Company’s operating model includes a combination of
stand-alone and combined business functions between the battery
and razors and blades businesses, varying by country and region
of the world. Shared functions include product warehousing and
distribution, various transaction processing functions, environmen-
tal activities, and in some countries, combined sales forces and
management. The Company applies a fully allocated cost basis, in
which shared business functions are allocated between the busi-
nesses. Such allocations do not represent the costs of such services
if performed on a stand-alone basis.
Wal-Mart Stores, Inc. and its subsidiaries accounted for 18.8%,
18.5% and 17.5% of total net sales in 2007, 2006 and 2005, respec-
tively, primarily in North America. Corporate assets shown in the
following table include all cash and cash equivalents, financial
instruments, pension assets and deferred tax assets that are man-
aged outside of operating segments.
Notes to Consolidated Financial Statements
(Dollars in millions, except per share and percentage data)